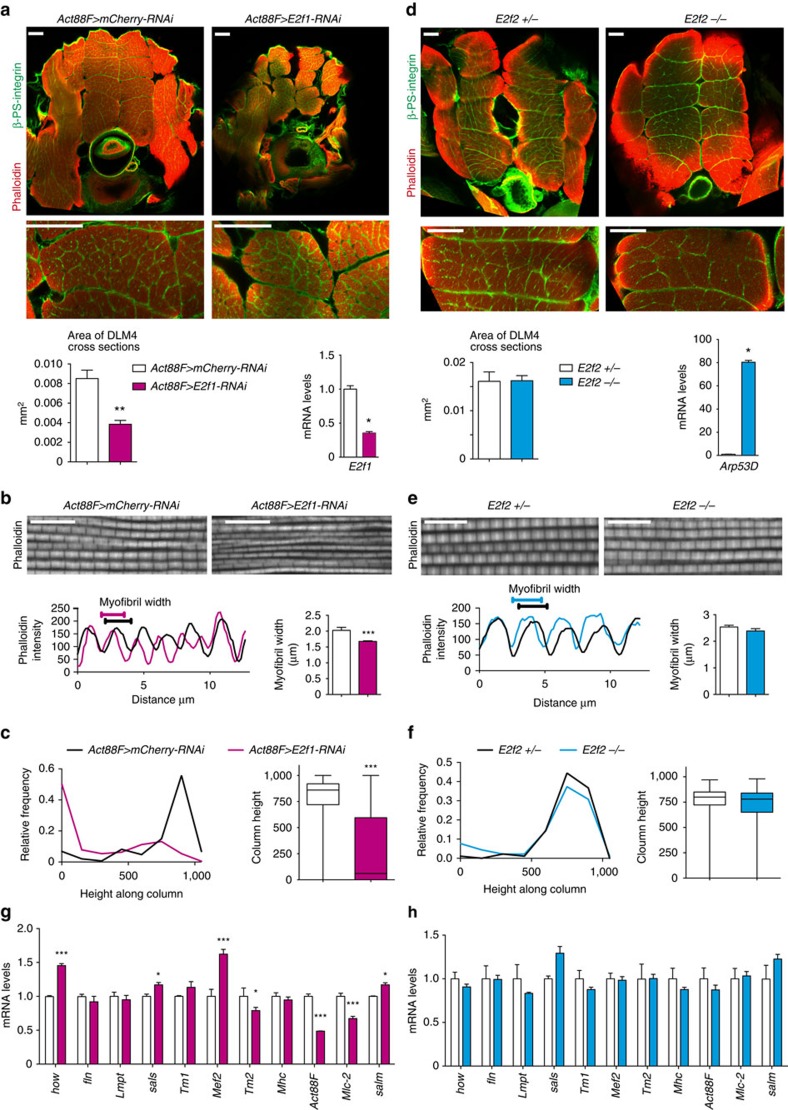
Figure 8. E2f1 is a major contributor to muscle growth and function in post-fused indirect flight muscles.
(a,d) Muscle size is reduced in E2f1-depleted muscles (Act88F>E2f1-RNAi), whereas E2f2 mutant muscles are normal. Transverse sections stained with Phalloidin and β-PS integrin (ventral to the bottom, top panel). DLM4 is magnified (middle panel). Scale bar, 50 μm. Representative images are shown. Quantification of DLM4 cross-section area per fly (mm2), mean±s.e.m., Mann–Whitney test, **P<0.01. (a) n=6, (d) n=3,4 flies per genotype. Expression of E2f1 (a, bottom right panel) and Arp53D (b, bottom right panel) in flight muscles measured by RT–qPCR. Mean±s.e.m., N=3 independent samples per genotype, Mann–Whitney test, *P<0.05. (b,e) Myofibril width is slightly reduced in Act88F>E2f1-RNAi, whereas in E2f2 mutant it is normal. Confocal images of DLMs in a sagittal view stained with Phalloidin. Scale bar, 10 μm. Profile plot of phalloidin intensity over distance (bottom left panel). A line perpendicular to myofibril orientation was drawn to determine the number of myofibrils per distance. Quantification of myofibril width (μm; bottom right panel), mean±s.e.m., Mann–Whitney test, **P<0.01. (b) n=7,8, (e) n=6 hemithoraces per genotype. (c,f) Flight performance is poor in Act88F>E2f1-RNAi adult flies, whereas in E2f2 mutant it is normal. Female flies were flipped into a mineral-coated column, and the frequency of flies landing over the height of the column was scored. Box plots (Min to Max), Mann–Whitney test, ***P<0.001. Three independent experiments were conducted. (c) n=147,205, (f) n=90,91 flies per genotype. (g,h) Muscle-specific gene expression is compromised in Act88F>E2f1-RNAi flight muscles of pharate, whereas no gross alteration is found in E2f2 mutant. Genes are how, fln, Lmpt, sals, Tm1, Mef2, Tm2, Mhc, Act88F, Mlc2 and salm. Mean±s.e.m., N=3 independent samples per genotype, two-way ANOVA, *P<0.05, ***P<0.001. Genotypes (a–c,g) Act88F-GAL4;UAS-mCherry-RNAi and Act88F-GAL4;UAS-E2f1-RNAi, (d–f,h) E2f2c03344/+ and E2f2c03344/E2f276Q1. Pharate (P96 h APF, a,b,g) and adult flies (c,d–f,h).

