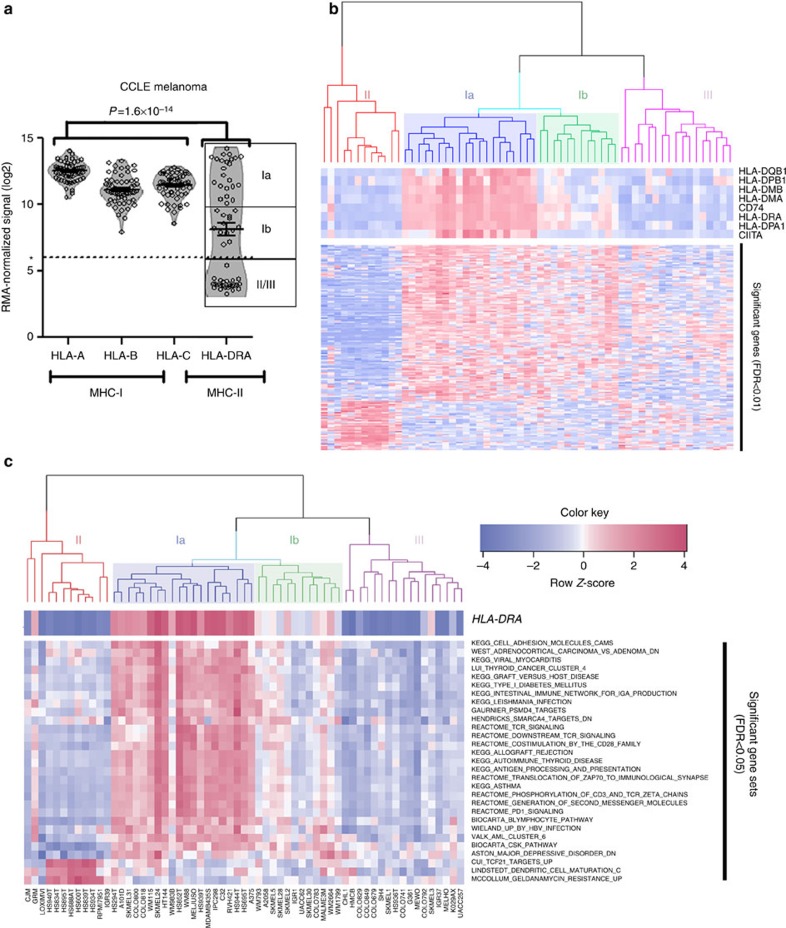
Figure 1. A unique subtype of melanoma expresses MHC-II.
(a) Microarray data from 60 melanoma cell lines in the CCLE48 were analysed for MHC-I (HLA-A/B/C and MHC-II (HLA-DRA) expression. Bars represent the mean±s.d. P value is the result of the Kolmogorov–Smirnov test comparing the distribution of MHC-I (HLA-A, HLA-B, HLA-C) expression with MHC-II expression (HLA-DRA). *represents the cutoff for defining MHC-II(+). (b) Gene-expression data from HLA-DRA(+) cell lines (Clusters Ia/Ib) were compared with HLA-DRA(−) cell lines (Clusters II and III) by an FDR-corrected row t-test. Significantly altered genes are shown on the y-axis and also listed in Supplementary Data 1. An ad hoc heat map is shown at the top, highlighting classical MHC-II genes. (c) Normalized microarray data were analysed by GSA47 using the curated Molecular Signatures Database, and the resulting gene set scores are presented as a hierarchical clustered heat map.

