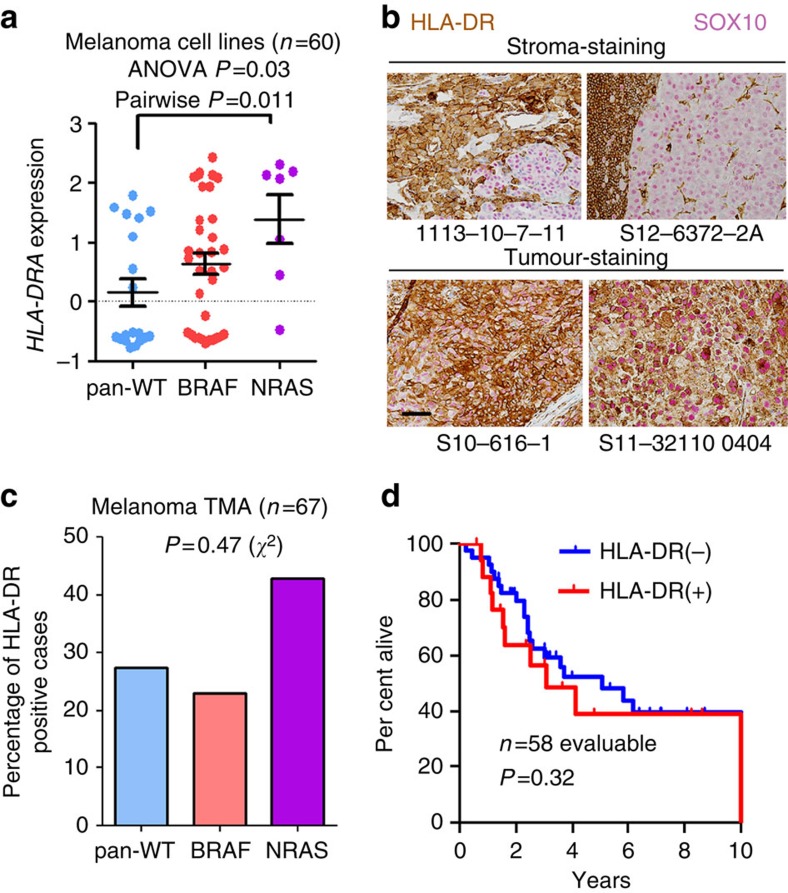
Figure 3. MHC-II-positive melanoma cell lines associate with NRAS mutations.
(a) HLA-DRA mRNA expression in melanoma cell lines (n=60; one cell line lacked mRNA expression data) from the CCLE compared by genotype. P value (P<0.05) represents result of Tukey's post hoc analysis comparing pan-WT with NRAS-mutant cell lines, following a significant ANOVA (P=0.03) performed among all groups. Bars represent mean±s.e.m. (b) Representative IHC for HLA-DR (brown) and SOX10 (pink) in cases with isolated stromal positivity (top) and with tumour-specific staining (bottom). Both HLA-DR and SOX10 immunostaining is present in all four sections. Scale bar, 50 μm. (c) Analysis of HLA-DR IHC in a melanoma TMA (n=67 evaluable) by genotype. P value represents result of a χ2-test. (d) Overall survival of patients (n=58 evaluable) within the TMA by HLA-DR status (left censored at time of diagnosis). The remaining patient samples were included from outside institutions and follow-up data were not available from those institutions. P value is the result of the log-rank test.

