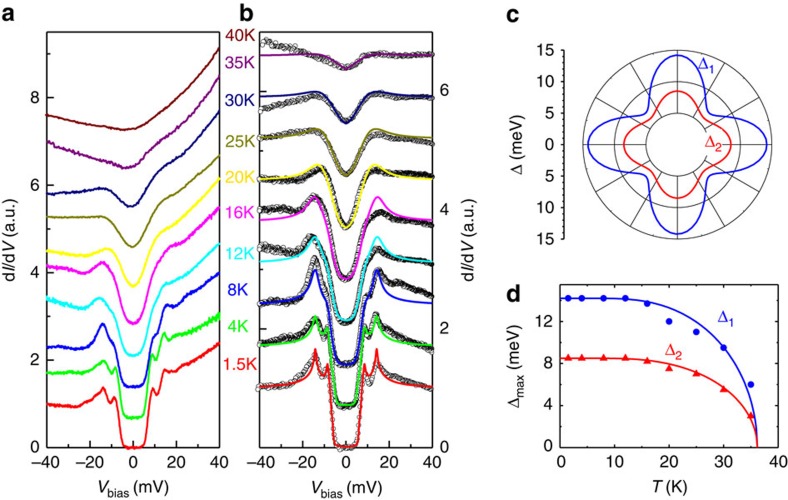
Figure 3. Temperature-dependent tunnelling spectra and theoretical fits.
(a) The evolution of the STS spectra measured at temperatures from 1.5 to 40 K. (b) Fitting results to the STS spectra normalized by the one measured at 40 K in the normal state. The dark hollow circles represent the experimental data, and the coloured solid lines are the theoretical fits to the data with two anisotropic s-wave gaps by the Dynes model. (c) The anisotropic-gap functions used in the fitting to the curve measured at 1.5 K. (d) Temperature dependence of the two gaps extracted from the Dynes model fitting, and the solid lines denote the theoretical calculations of the superconducting gap from the BCS model.

