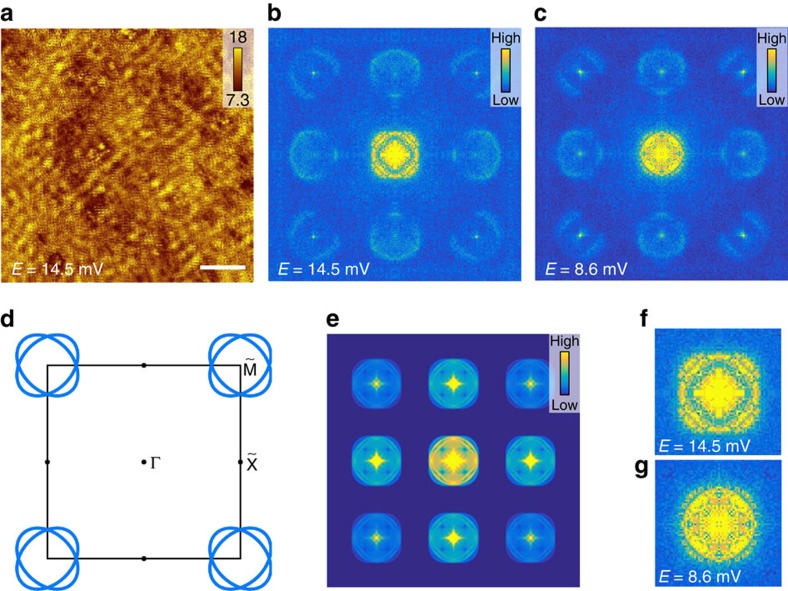
Figure 5. Quasiparticle interference patterns and theoretical simulation.
(a) QPI image g(r, E=14.5 mV) in real space measured at 1.7 K near the energy of the coherence peak position of the larger gap. Scale bar, 5 nm. (b,c) FT-QPI intensity ρ(q, E) obtained by taking Fourier transformations on the corresponding real-space image measured with energies near the coherence peak position of the two gaps, namely 14.5 and 8.6 mV. The images are fourfold symmetrized to enhance the signal. (d) Schematic plot of the elliptic-shaped electron pockets in folded Brillouin zone. (e) The theoretical simulation of the QPI scattering intensity by applying autocorrelation to d. (f,g) Zoom-in images of the central parts of b and c, which contain the information of the small-q intra-pocket scattering. The image at 14.5 mV is very similar to the structure of the central pattern in (e). However the central pattern at 8.6 mV has a very different shape, and the outer ring seems to be less pronounced.

