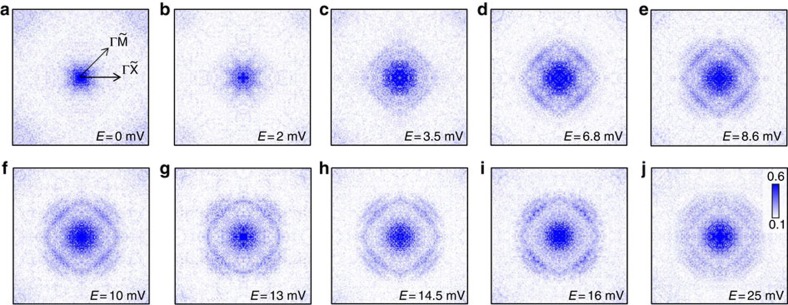
Figure 6. The evolution of FT-QPI intensity ρ (q, E ) at different energies.
(a–j) The FT-QPI ρ(q, E) images are derived from Fourier transformation on the QPI images with the real-space scale of 58 nm × 58 nm. A 2D-gaussian-function background was subtracted from the raw FT-QPI image and the fourfold symmetrization was carried out to enhance the signal. The intensity on the inner ring in q-space shows up at above 3.5 mV, the ring becomes clear at the energy of the smaller gap, namely 8.6 mV, while the segments corresponding to the outer ring appear gradually with a higher energy above 6.8 mV, and are clear when measuring with the voltage at the larger energy gap 14.5 mV.

