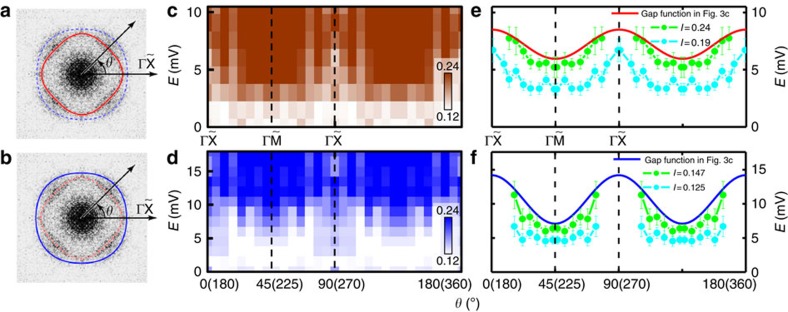
Figure 7. 2D colour plots of FT-QPI intensity ρ(θ, E) along the inner and outer contours of the central pattern in q-space.
(a,b) The FT-QPI pattern taken at 14.5 mV. The
solid-line contours in a and b were expressed approximatively
by R1−r1cos4θ
and R2+r2cos4θ
for outer and inner rings, respectively. (c,d) The FT-QPI
intensity along the inner (a) and outer (b) rings at different
angles taken from the fourfold symmetrized FT-QPI patterns in Fig. 6 with various energy values. The initial polar angle
starts from the  direction. The gap minimum
locates in the
  direction for both contours.
(e,f) The angle-dependent energy thresholds taken from the
vertical line-cuts to the colour plots in c,d by using the
intensity I=0.19, 0.24 (0.125, 0.147) for the inner
(outer) rings in a,b, respectively. The gap minimum locates in
the
  direction for both contours. The solid
lines in e,f plots are the gap functions derived from the
Dynes model fitting to the spectrum taken at 1.5 K. The error
bars were determined from the deviations between the line-cut experimental
data and the polynomial fitting curve for each angle.

