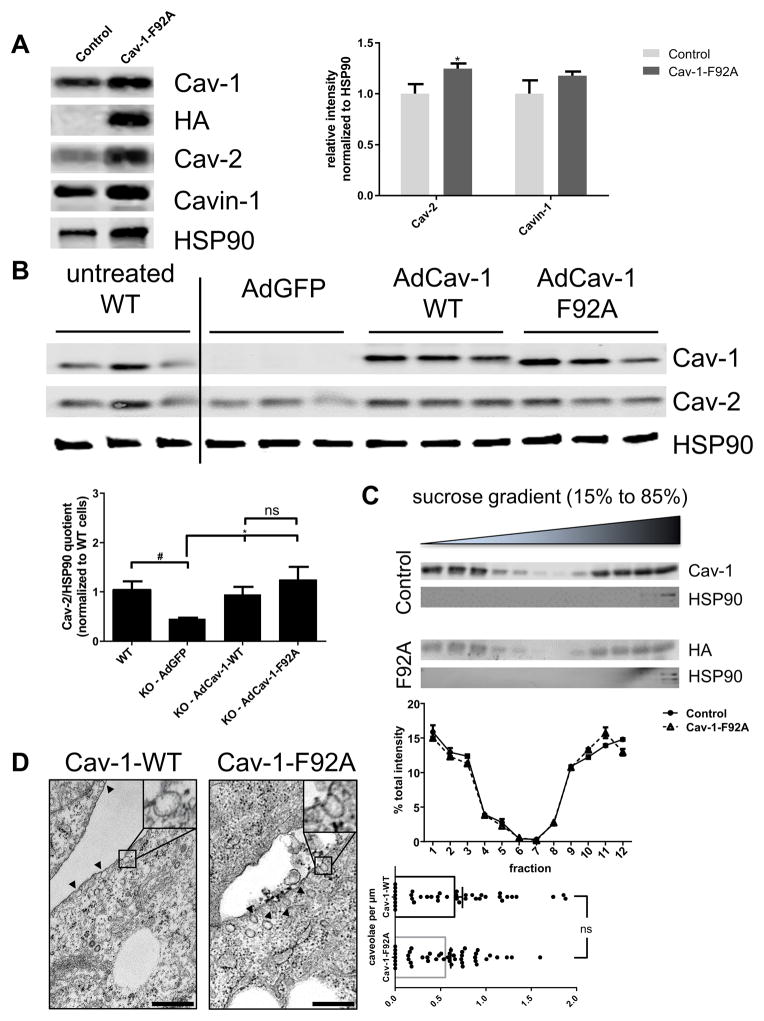
Figure 3. Stability of caveolae in the presence of Cav-1-F92A mutant.
A, Left panel, Whole lung protein from single and double transgenic mice was analyzed for the expression of Cav-2 and Cavin-1. Cav-1 and HA immunoblotting as a control for the expression of the transgene. HSP90 was used as loading control. Right panel, Quantification of the relative intensity of Cav-2 and Cavin-1 normalized to HSP90. B, Adenoviral reconstitution of immortalized Cav-1 KO MLECs with either GFP, Cav-1 WT or Cav-1-F92A mutant. Immortalized WT cells are loaded as control for the expected expression level of Cav-1 and Cav-2. Cav-2 immunoblotting as a readout for the stability of caveolae. C, Top panel, Immunoblot analysis of Cav-1 (WT, endogenous) and (HA, transgene) of the sucrose gradient fractions. HSP90 was used as marker for bulk fractions. Lower panel, Quantification of the immunoblot represented as % band intensity per fraction. D, TEM images for Cav-1 KO MEFs adenoviral reconstituted with WT or Cav-1-F92A mutant. Scale bar is 500 nm. At least 35 individual images were analyzed per group for the quantification of caveolae/μm of plasma membrane.

