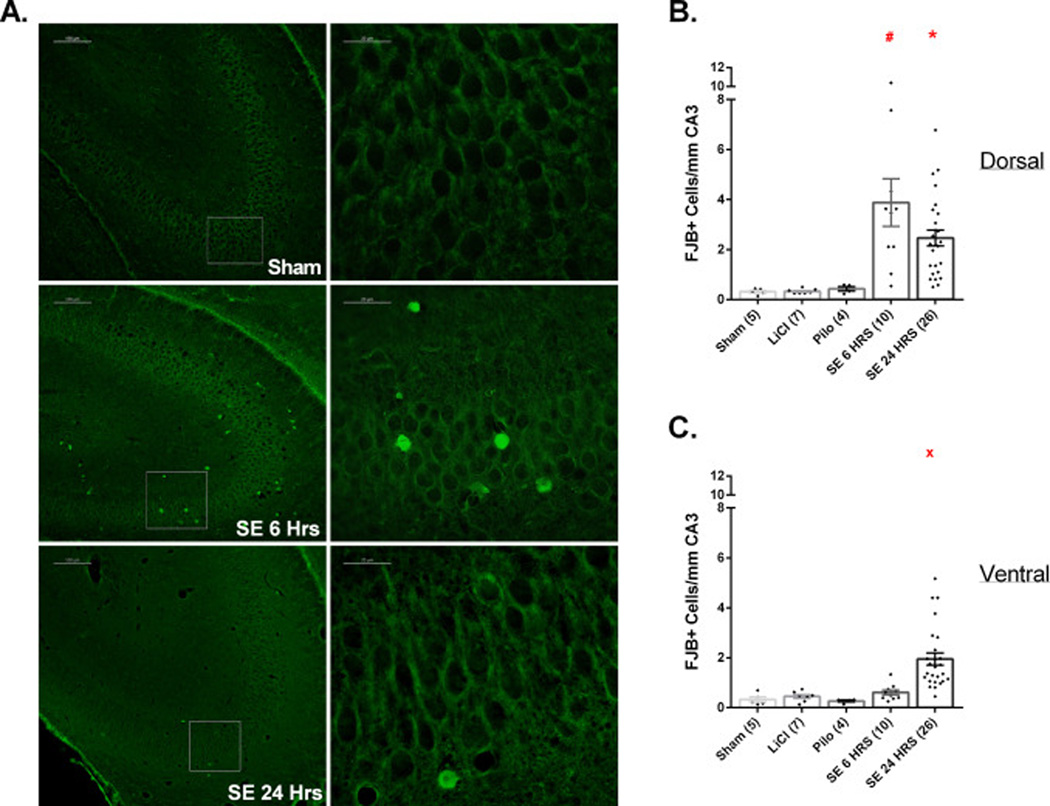
Figure 3.
SE results in significant neuronal injury in dorsal/ventral CA3.
(A). Images of FJB staining in CA3 among Sham, SE6Hrs, and SE24Hrs animals. The image on the right of each row is a higher magnification of the boxed area on the image on the left. (B, C) Extent of neuronal injury in dorsal (B) and ventral (C) CA3 pyramidal cell layer. (B) # p<0.05: SE 6 HRS vs. Sham, LiCl, Pilo (analyzed by Dunn’s test). * p<0.05: SE 24 HRS vs. Sham, LiCl (Dunn’s test); vs. Pilo (Mann-Whitney test). (C) × p<0.05: SE 24 HRS vs. Sham, LiCl, Pilo, SE 6 HRS (Dunn’s test). Scale bars: (A) left column=100 µm (low magnification images) and right column 20 µm (high magnification images).

