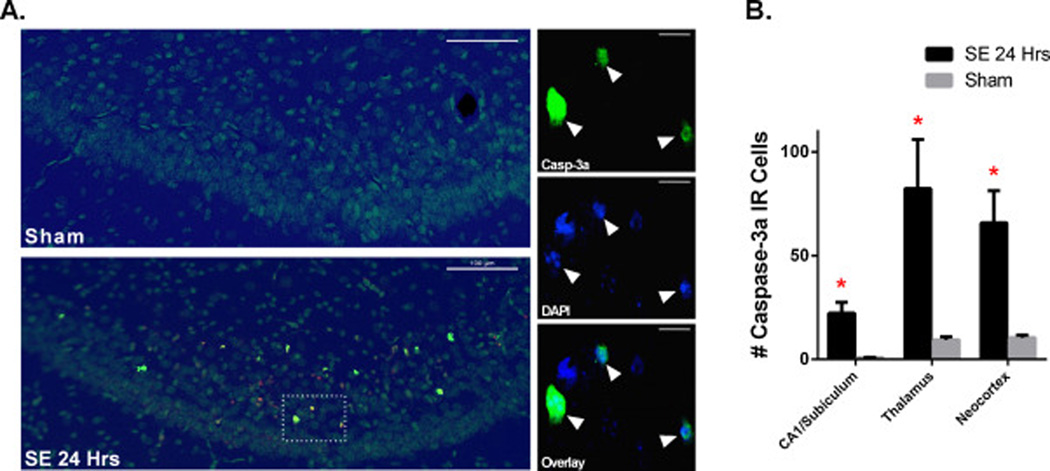
Figure 6.
SE significantly increases caspase-3 activation. (A) Images of overlay of caspase-3a IR (yellow) and DAPI (blue) staining in subiculum of Sham (n=5) and SE24HRS (n=5) pups. On left, overlay of subiculum at low magnification shows distribution of caspase-3a IR cells in subiculum; on right, high magnification images show that caspase-3a IR cells have fragmented nuclei indicative of neuronal cell death in SE24HRS. (B) Graph showing that SE significantly increases caspase-3a IR cells in CA1/Subiculum, thalamus, and neocortex compared to Sham. * p<0.05: SE 24 HRS vs. Sham (analyzed by Holm-Sidak test). Scale bars: (A) left column=100 µm (low magnification images) and right column 20 µm (high magnification images).

