Figure 2.


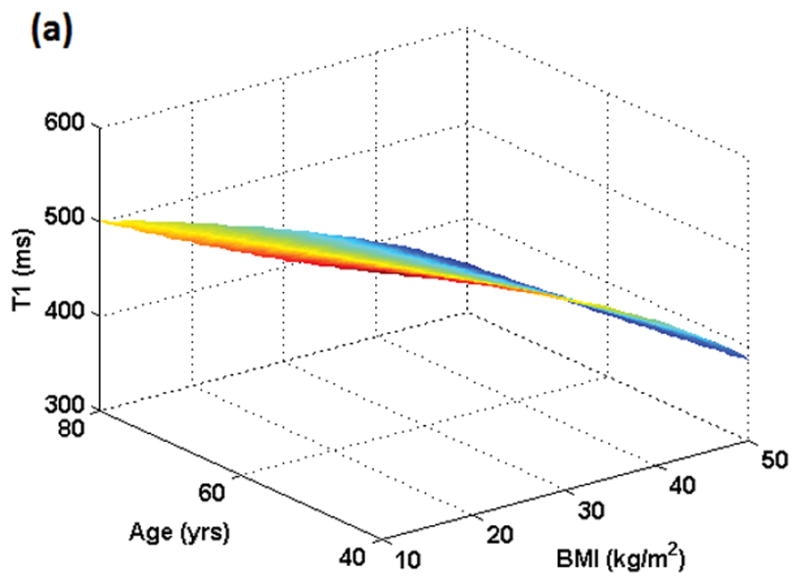
Figure 2 (a): Simulation of T1 variation in the female population resulting from dose administered in mmol/kg as a function of BMI and age. Minimum T1 value will result at the oldest age (80 yrs here) and highest BMI (50 kg/m2 here). All individuals who weigh the same but have different BMIs and ages would exhibit different T1 values post-contrast although the administered dose was the same based on mmol/kg.
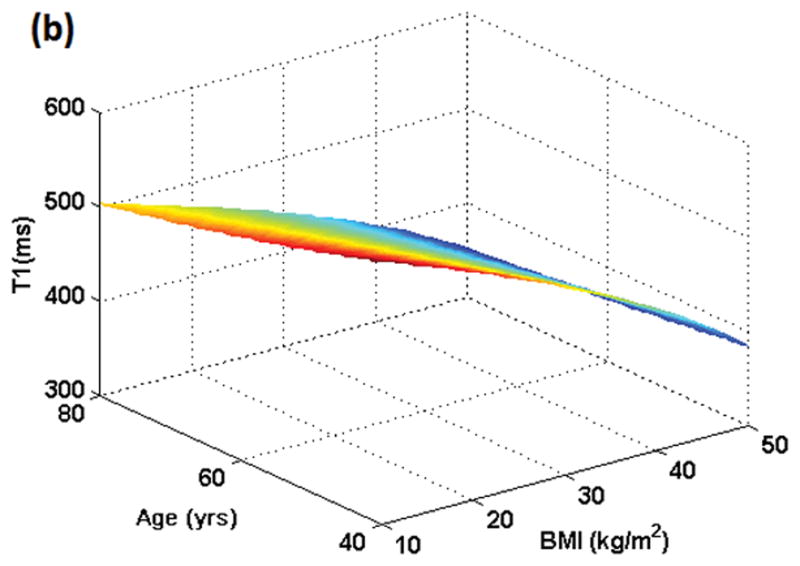
Figure 2 (b): Simulation of T1 variation in the male population resulting from dose administered in mmol/kg as a function of BMI and age. Minimum T1 value will result at the oldest age (80 yrs here) and highest BMI (50 kg/m2 here). All individuals who weigh the same but have different BMIs and ages would exhibit different T1 values post-contrast although the administered dose was the same based on mmol/kg.
