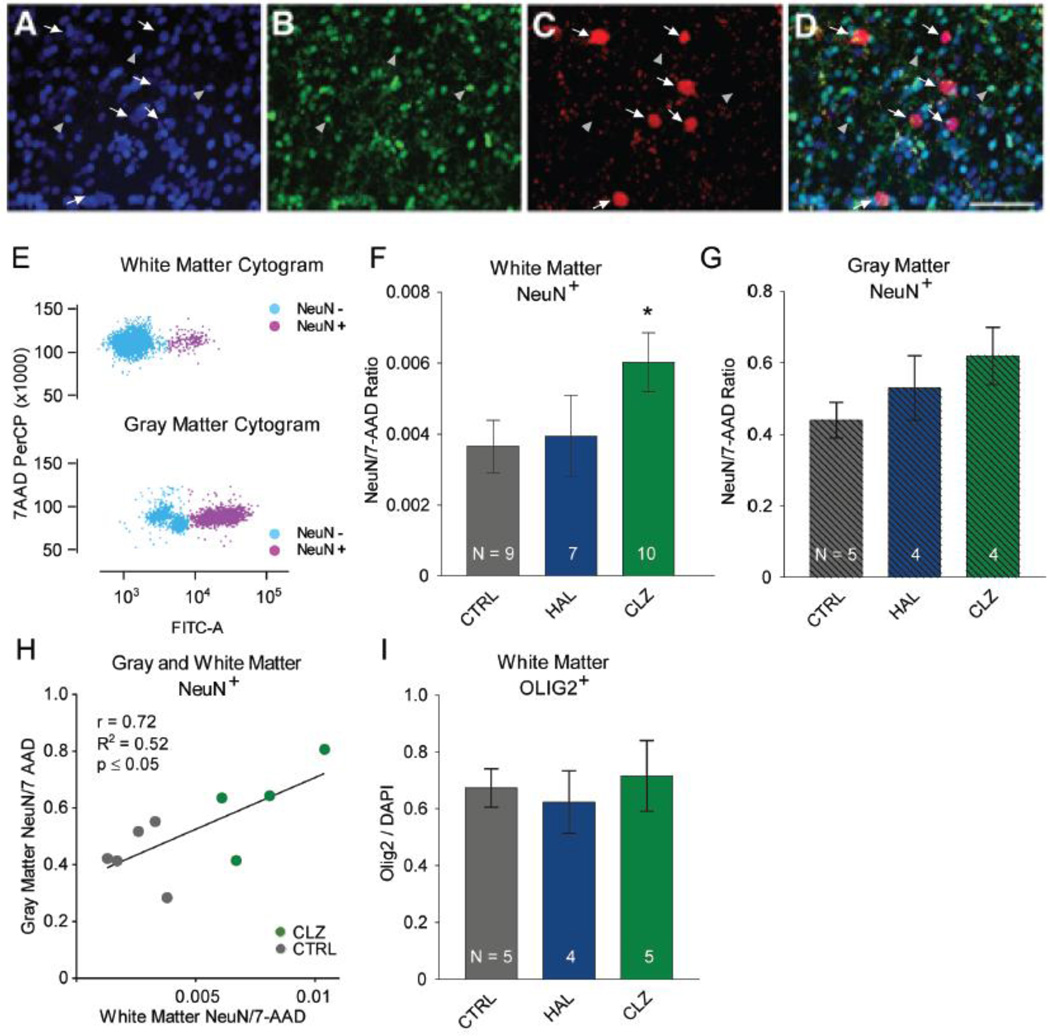
Figure 2. Cell composition in frontal lobe gray and white matter after antipsychotic drug treatment.
(A–D): Immunofluorescence confocal microscopy from an adult macaque monkey dorsolateral prefrontal white matter. NeuN+, red; Olig2+ green; DAPI counterstain blue. White arrows mark subsets of NeuN+ nuclei and gray arrowheads mark subset of (OLIG2+) nuclei. Note the complete lack of overlap between NeuN+ and Olig2+ cell populations. Scale bar, 10 µm. (E): White matter (top) and gray matter (bottom) fluorescence-activated cell sorting (FACS) dot plots after approximately 100,000 sorting events. Nuclei from neuronal and non-neuronal cells were incubated with antibodies against the neuron-specific epitope NeuN (conjugated to Alexa488) and the fluorescent DNA marker (7AAD). Alexa488-based immunofluorescence (measured in the FITC channel) allows for near-complete separation of neuronal NeuN+ nuclei in purple and non-neuronal NeuN− nuclei in blue. Note the much higher proportion of NeuN+ nuclei in gray as compared to white matter. (F, G): Proportion of NeuN+ nuclei among total pool of nuclei stained with 7-AAD DNA dye in tissue punches from white (F) and gray matter (G).. Notice increased proportion of NeuN+ nuclei in white and gray matter after clozapine (CLZ) treatment, while haloperidol (HAL)-exposed monkeys show a smaller, non-significant NeuN+ increase. (H) Correlation between (y-axis) gray and (x-axis) white matter NeuN+ nuclei in CLZ-treated and CTRL monkeys. (I) Bar graphs summarizing proportion of OLIG2+ nuclei in white matter tissue punches, expressed as fraction of nuclei counterstained with nucleophilic dye DAPI.

