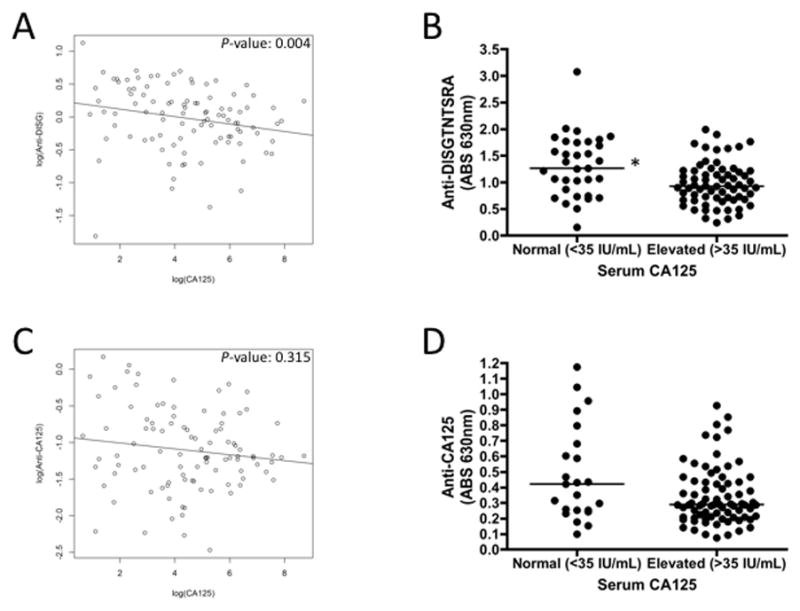
Figure 4. Correlation of serum CA125 with anti-DISGTNTSRA or anti-CA125.

OvCa patient serum from time of diagnosis was assessed for serum CA125 and antibodies to DISGTNTSRA and purified CA125. Scatter plots of log(CA125) vs log(anti-DISGTNTSRA) (A) or log(anti-CA125) (C) are shown, with P-values determined for Spearman’s rank correlation. Patients with grouped by normal or elevated serum CA125 and anti-DISGTNTSRA (B) or anti-CA125 (D) was determined. The line is presented at the median for each group. * P-value = 0.0033 (Mann-Whitney).
