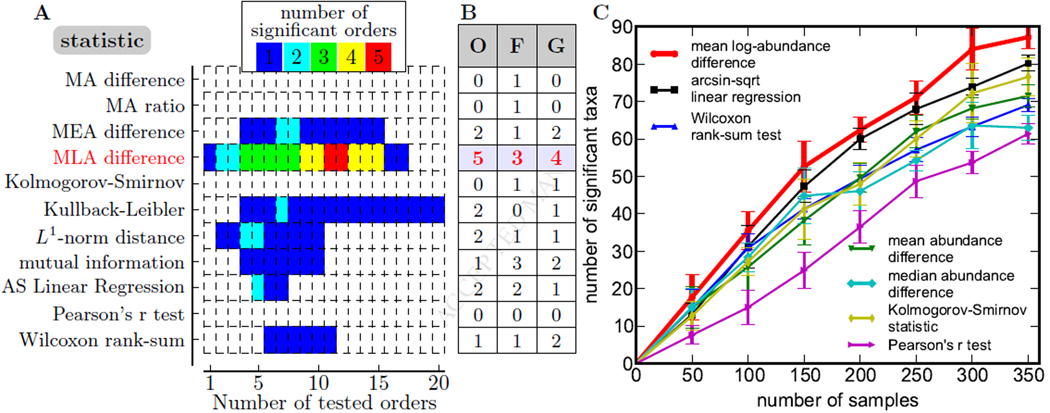
Figure 3. Statistical methods differ is their ability to detect association.
(A) The number of significantly associated orders (FDR=0.05; permutation test) is shown for different statistical tests and different number of orders tested. Orders were tested in the order of their abundance. Initially, the number of detected orders increases with the number of tests because true positives are more likely to be included in the set of orders tested, but it eventually declines because the threshold for statistical significance increases with the number of tests. MA: mean abundance. MEA: median abundance. MLA: mean log-abundance. AS: arcsine-square-root.
(B) The maximal number of associations detected by a procedure illustrated in (A) is shown for three phylogenetic levels (O: order, F: family, G: genus); mean log-abundance outperforms other methods.
(C) The procedure illustrated in (A) was applied to subsamples from the RISK data. The mean log abundance outperforms other methods for all sample sizes; see Figure S1 for statistical significance. Error bars are standard deviations from 10 sub-samplings. The power of the detected associations at discriminating control from CD samples and further details are shown in Figure S1.

