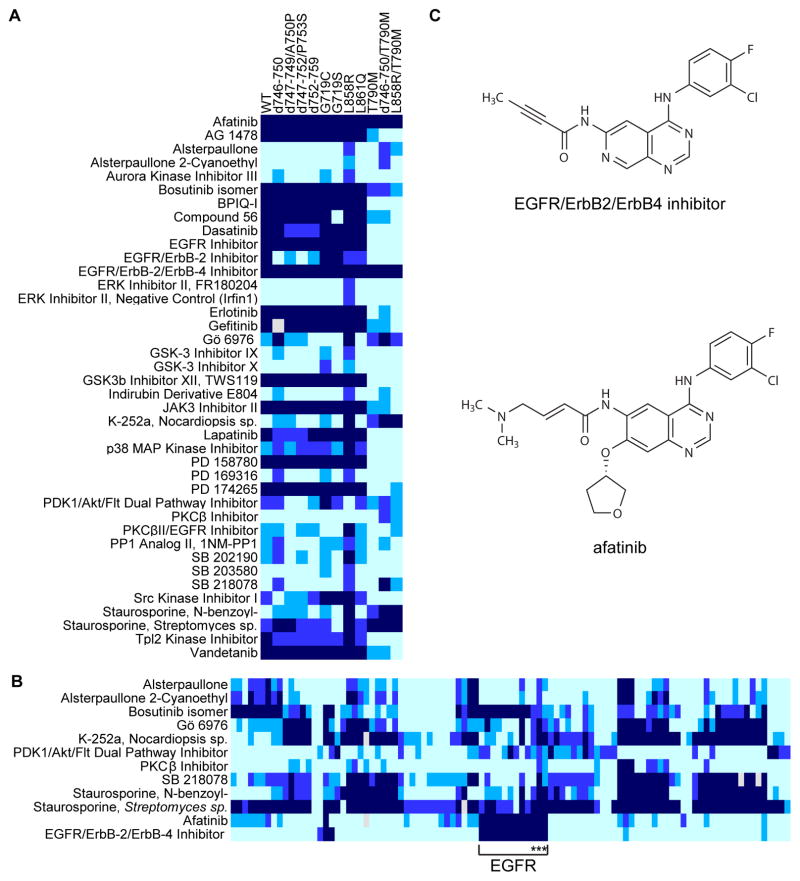
Figure 4. The EGFR/ErbB2/ErbB4 Inhibitor and afatinib inhibit T790M EGFR.
(A) Heatmap representing compounds that inhibit any EGFR mutants with less than 50% remaining kinase activity. Coloring is as in Figure 2.
(B) Heatmap representing compounds that inhibit one or more of the T790M EGFR mutants with less than 50% remaining kinase activity. The EGFR family is indicated with the bracket and the EGFR variants containing T790M are indicated with asterisks. An explicitly labeled heatmap is provided in Figure S3.
(C) Chemical structures of the EGFR/ErbB2/ErbB4 Inhibitor and afatinib.

