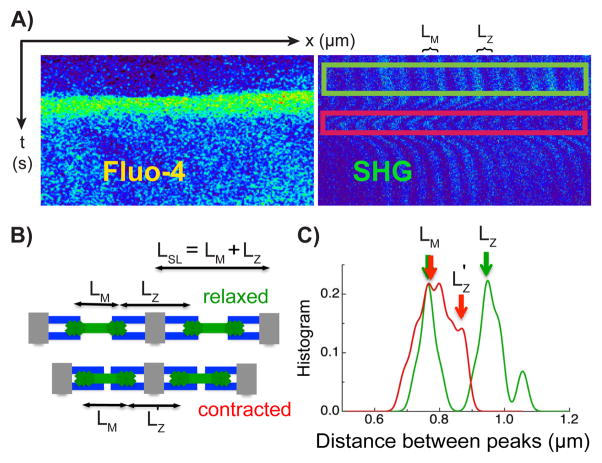
Figure 3. Relationship between sarcomere structure and A-band position.
(A) SHG-2PF linescan imaging of the myocyte shows a Ca2+ transient seen in the Fluo-4 signal (top left panel of images on right) and the triggered contraction in the SHG signal (top right panel). (B) LM is the distance between two adjacent A-bands within the same sarcomere. LZ is the distance between the two A-bands across the adjacent sarcomeres. The sarcomere length LSL is equal to the sum of LM and LZ. LZ shortens during cell contraction due to the sliding of the thick filament against the thin filament. (C) The histogram of A-bands distances is calculated using the kernel density method described in the online methods. LM is determined by the thick filament structure within the sarcomere and does not change during cell contraction. LZ shortens as described. The numerical values of LSL during systole and diastole calculated in this way match with sarcomere length calculated using a Fourier transform based method in a similar myocyte (Online Figure I).

