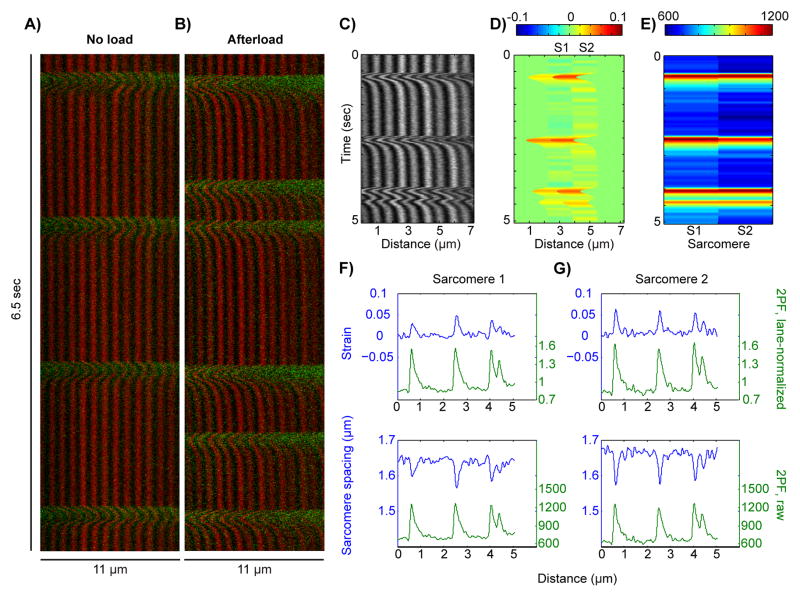
Figure 7.
Multimodal SHG-2PF imaging of cardiac myocytes from transverse aortic constriction (TAC) mice. (A) SHG (red) and 2PF (green) data from an isolated TAC cardiac myocyte under no load, paced at 0.5 Hz. (B) SHG and 2PF data from a TAC cardiac myocyte embedded in a gel to produce afterload, showing calcium tides while being paced at 0.5 Hz. (C–D) Strain map analysis of a localized 2-sarcomere region from a TAC cardiac myocyte under afterload and 0.5 Hz pacing. (E) 2PF signal within the corresponding sarcomeres from (D). (F–G) Plots of sarcomere strain vs. lane-normalized 2PF (top) and sarcomere spacing vs. raw 2PF (bottom).

