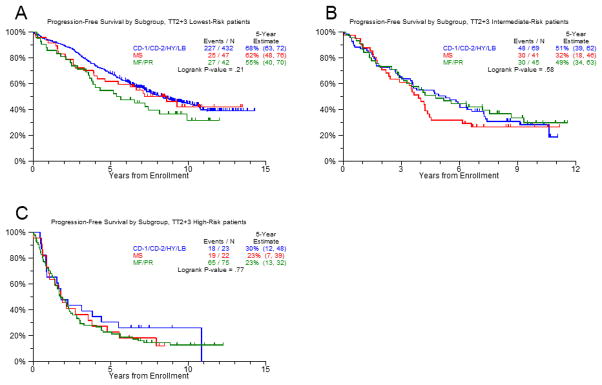
Figure 4. Progression free survival in molecular subgroups according to risk status.
Using the running log-rank test for the GEP70 score for PFS within the low-risk TT2 population and validating the result with TT3 data, we calculated a three-group risk predictor with an additional break point at 0.16. We split the data at the additional break point and at 0.66. We combined the subgroups with a favorable outcome (CD-1, CD-2, HY, and LB) and compared their PFS to MS (significantly improved by novel drugs) and the unfavorable subgroups MF and PR in low risk (A), medium risk (B) and high risk (C) cases.

