Figure 2.

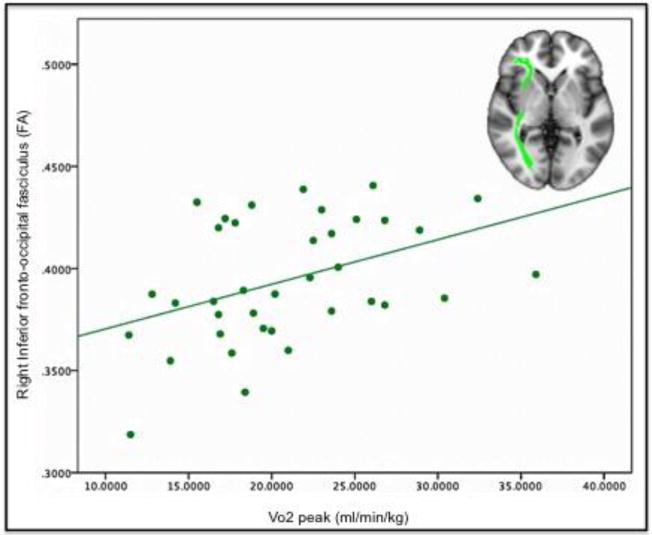
Linear fit plot for VO2peak and fractional anisotropy (FA) in the right inferior fronto-occipital fasciculus (green). The tract-of-interest is overlaid on a T1 MNI template, and orientation is radiological (left is right).

Linear fit plot for VO2peak and fractional anisotropy (FA) in the right inferior fronto-occipital fasciculus (green). The tract-of-interest is overlaid on a T1 MNI template, and orientation is radiological (left is right).