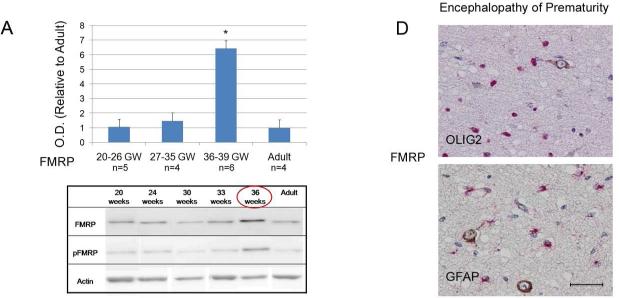
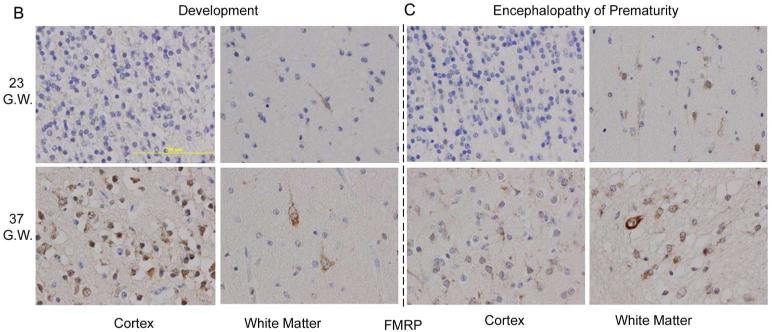
Figure 1. FMRP expression in the brain during normal development and in encephalopathy of prematurity.
A) Western blots quantification of total FMRP expression during normal human cortical development (n=15). Histograms represent averaged optical density normalized to actin, and expressed relative to the mean adult controls values (n=4). * p < 0.0001 vs. adult control, GW = gestational weeks; OD = optical density. Inset: representative western blot analyses for total and phospho-FMRP at five different developmental time points and in an adult control. B) Representative immunohistochemical stains showing overexpression of FMRP in the human cortex (brown staining) at 37 gestational weeks compared to 23 gestational weeks of normal development. White matter shows no difference in FMRP expression in the same gestational periods. C) Representative immunohistochemical stains showing no change in FMRP expression in the brain of patients with encephalopathy of prematurity during 23rd and 37th gestational weeks. D) FMRP/OLs (OLIG2) and FMRP/astrocytes (GFAP) double-labeling in white matter neurons showing no co-expression (Size bar 50 μm).


