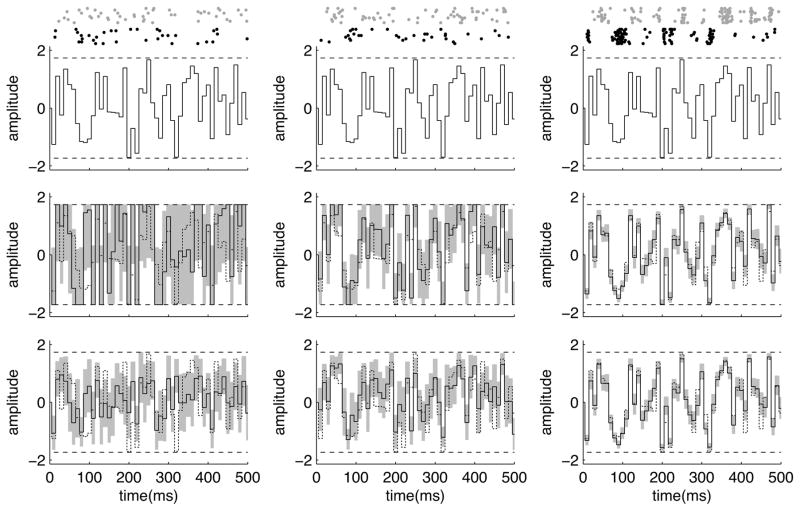
Figure 6.
Comparison of MAP and posterior mean estimates, for 10 identical and independent pairs of ON and OFF RGC’s, for different values of the stimulus filter. The stimulus and all GLM parameters are the same as in Fig. 5, except for the number of pairs of RGC. The increase in the number of cells leads to the sharpening of the likelihood, leading to smaller error bars on the estimates, and a more accurate Laplace approximate and smaller disparity between the two estimates. Here a 20000 sample long MALA chain (after burning 5000 samples) was used to estimate the posterior mean.

