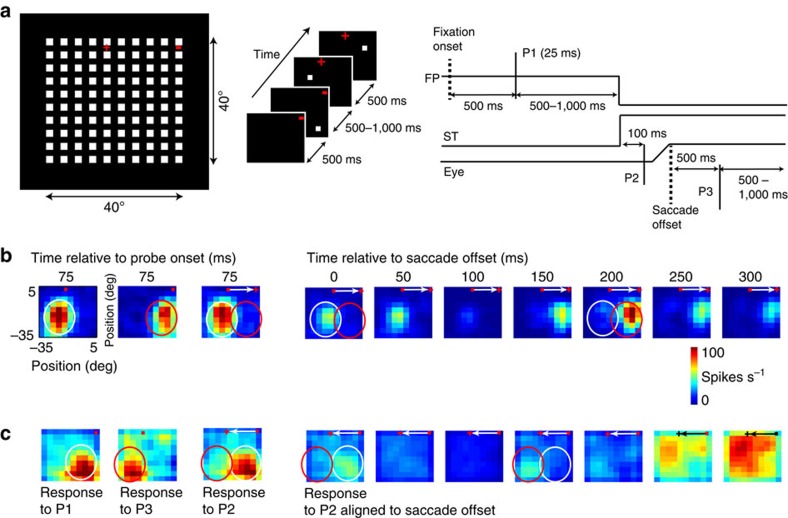
Figure 1. Illustration of experimental paradigm and example neurons.
(a) (left) All possible visual probe locations (10 × 10 probe grid) spanning 40° of visual space (figure not drawn to scale for clarity). Fixation point (red dot) and saccade target (red ‘+') indicate the leftward direction of the horizontal, visually guided saccade in this example. (middle) Sequence of visual stimuli on an example trial, including the fixation targets and the appearance of the three probes at random locations. (right) Time course of a single trial. (b) Receptive field of an example neuron for probes flashed during fixation (left two panels; fixation points indicated by red dot) and those flashed immediately before an ‘away saccade' (defined as a saccade directed horizontally away from the hemifield containing the receptive field) indicated by white arrows (third panel: responses aligned to probe onset; and fourth panel and onwards: responses aligned to saccade offset). (c) Receptive field of another example neuron for a ‘towards saccade' (defined as a saccade directed horizontally towards the hemifield contacting the receptive field) (same scheme as in b). FP, fixation point; ST, saccade target.

