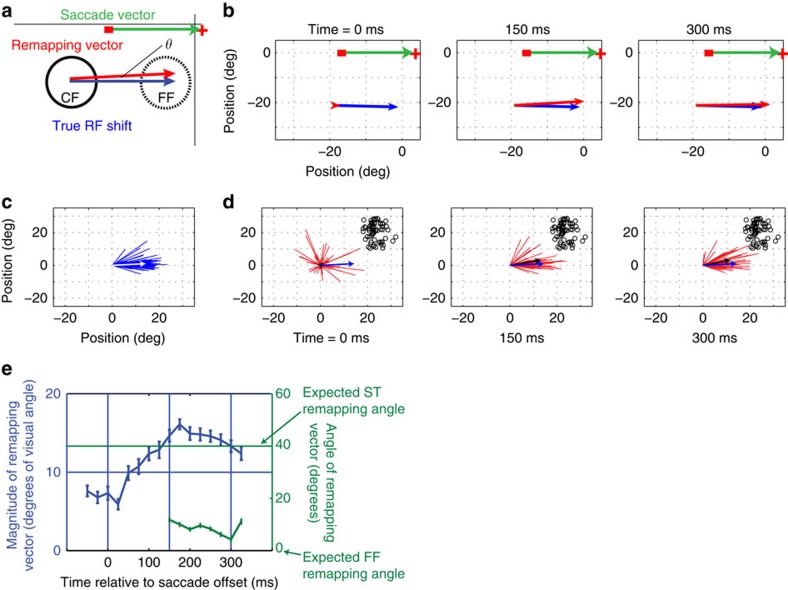
Figure 2. Quantification of receptive field remapping for away saccades.
(a) A cartoon of the CF (solid black) and the FF (dotted black) of a hypothetical neuron for an away saccade (green arrow). The true receptive field shift is a vector connecting the centres of the CF and FF (blue arrow). Similarly, the actual remapping vector connects the centre of the CF and the centre of the perisaccadic receptive field (red arrow). The magnitude of this vector and its angle of rotation (indicated by θ) relative to the true receptive field shift vector (blue arrow) are used to quantify receptive field remapping. (b) True RF shift vector (obtained by joining RF centres 75 ms after P1 and P3 onset, respectively) and remapping vector of the example neuron from Fig. 1b at different times relative to the saccade offset. (c) True RF shift vectors of the population of 86 neurons. The white arrow indicates the average vector. (d) Remapping vectors of the population of cells at different times relative to saccade offset. The black arrows indicate the average vectors. The blue arrow shows the average true RF shift (same as white arrow in (c)). Since all the RFs are centred at the origin, the saccade target positions vary (indicated by small black circles). (e) Time course of the average magnitude (blue; error bars represent s.e.m. across the population of neurons) and mean direction (green; error bars represent circular s.d.) of the remapping vectors relative to the saccade offset. Vertical lines indicate analysis time points at 150 and 300 ms post saccade, as well as saccade offset at 0 ms. CF, current field; FF, future field.

