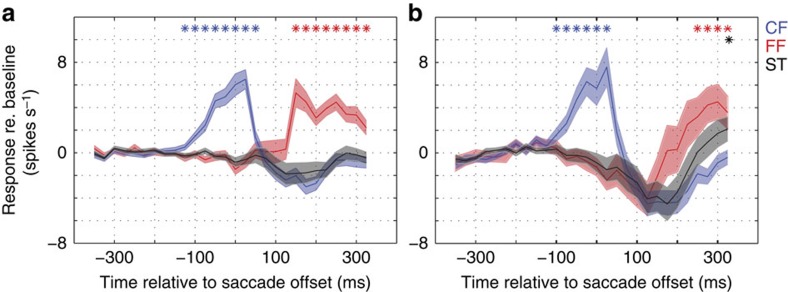
Figure 4. Temporal dynamics of different types of remapping in V4.
(a) Average responses to P2 probes flashed at the CF (blue), FF (red) and saccade target location (black) for away saccades (n=83). Baseline responses before the probe onset were subtracted from the response curves. (b) Responses to P2 probes flashed at the CF (blue), FF (red) and saccade target location (black) for towards saccades (n=54). Stars indicate responses that were significantly above baseline (one sample t-test, P<0.05) and shades represent s.e.m. across the respective population of neurons.

