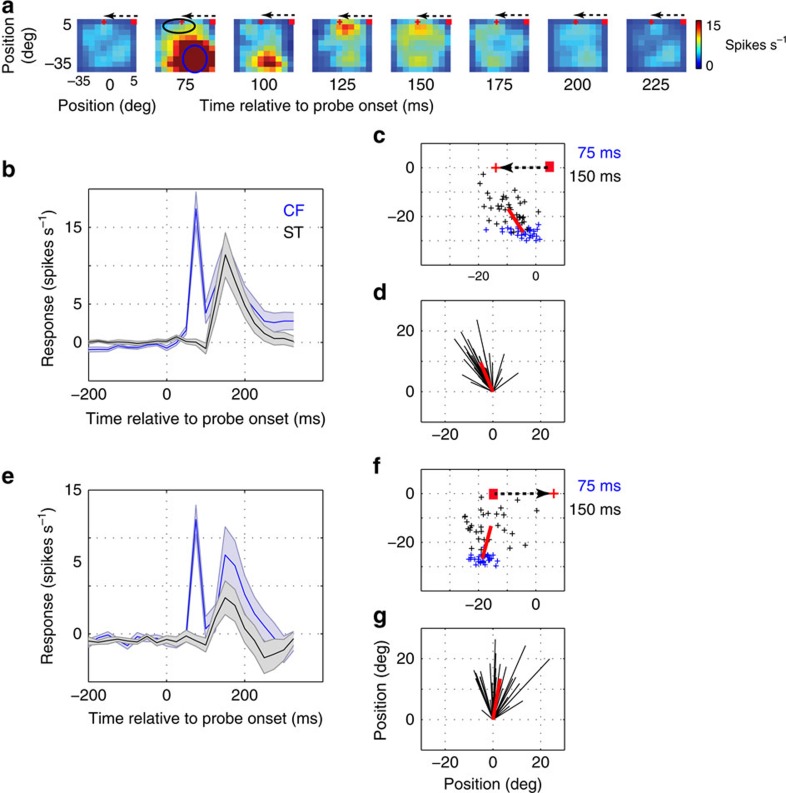
Figure 5. Receptive field remapping during fixation.
(a) Time course of the receptive field of an example neuron during fixation. The fixation point is indicated by the red dot, and the saccade target is indicated by the red ‘+, which will appear 500–1,000 ms after P1 probe onset. Dotted arrow indicates an impending saccade after the target appearance. (b) Average temporal dynamics (n=35 neurons) of responses to probes flashed at the CF (blue) (indicated by blue circle in the second panel of Fig. 5a) and those at the saccade target (black) (indicated by black circle in the second panel of Fig. 5a) during fixation before towards saccades. (c) RF centres at visual latency of 75 ms (blue ‘+') and those at 150 ms (black ‘+') after probe onset during fixation at the red dot. The red line indicates the vector connecting the average RF locations at the two time points after probe onset. (d) The black lines represent the vectors connecting the RFs at 75 ms and RFs at 150 ms after probe onset. RFs at 75 ms are aligned for quantifying the average direction of RF shift. (e) Average temporal dynamics (n=31 neurons) of responses to probes flashed at the CF (blue) and those at saccade target (black) during fixation before away saccades. (f) RF centres at visual latency of 75 ms (blue ‘+') and those at 150 ms (black ‘+') after probe onset during fixation at the indicated red dot. (g) Same as d. Shades represent s.e.m. across the respective population of neurons.

