Figure 2.
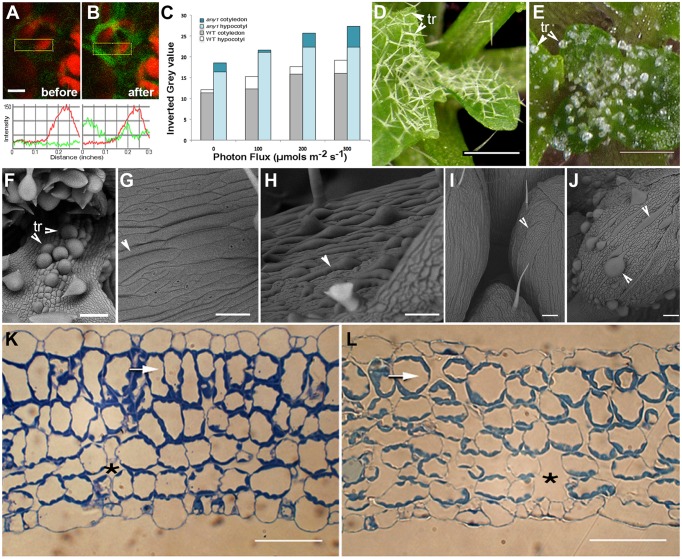
Observations suggesting changes in subcellular H2O2 levels in response to HL and characteristic features of the any1 mutant in comparison with wild type Arabidopsis. (A,B) A leaf epidermal cell in a transgenic Arabidopsis plant expressing HyPer-cytosolic probe (A) before and (B) after exposure to HL. Line traces based on the boxed areas are provided below the fluorescent images and show a nearly 2.5-fold general increase in green fluorescence intensity suggesting an increase in cellular H2O2 levels. Red chlorophyll auto-fluorescence is from chloroplasts in the mesophyll layer. (C) DAB staining of WT and any1 mutant leaves exposed to increasing light intensity suggesting relatively higher H2O2 production and catalase activity in any1 cells. (D,E) Leaf epidermal trichomes (tr) in WT (D) and the any1 mutant (E) exhibit spectacular differences in growth anisotropy. (F) A scanning electron (SEM) image shows that the glassy-appearing trichomes as well as some non-trichome cells near the leaf base appear swollen due to isotropic growth in any1. (G,H) Arrowheads pointing to elongated cells in WT leaves suggest their relatively flat nature (G) as compared to the bulged cells in petioles of any1 (H) mutant. (I,J) Giant cells in the sepal epidermis in WT (I; arrowhead) are relatively thin and unobtrusive compared to the large, swollen cells in the mutant (J; arrowheads). (K,L) Toluidine blue-O stained sections of WT (K) and any1 (L) leaves at a similar stage of development show differences in the relative size of cells and intercellular spaces (*). The sub-epidermal layer in the mutant (arrows) is relatively disorganized and cells show approximately 35% decrease in elongation (19.3 μm vs. 29.7 μm long in wild type). Size bars in (A) = 5; (D,E) = 250; (F–J) = 100; (K,L) = 50 μm

