Figure 3.
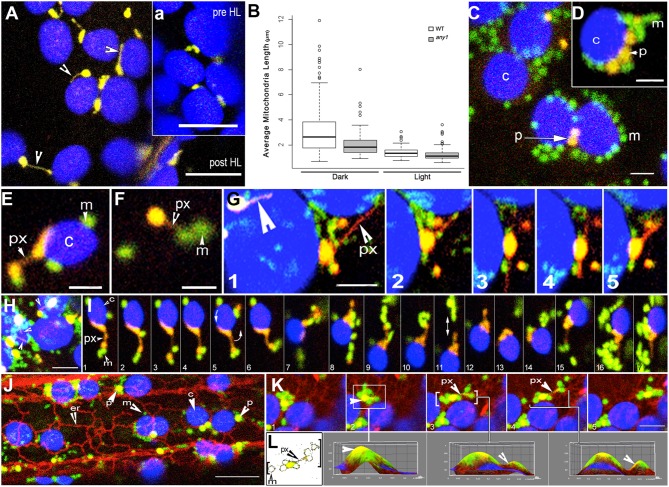
Peroxisome and mitochondria in wild type and any1 mutant Arabidopsis plants. (A) A single cotyledon mesophyll cell exhibits peroxules in the YFP-PTS1 line in the any1 mutant. Time lapse sequence shown as Movie S4. The inset “a” shows a portion of the same cell before HL exposure. (B) Mitochondrial length, taken as an indicator of increased cellular ROS is significantly smaller in the any1 mutant in comparison to WT under both light and dark growth conditions on medium without sugar (p < 0.05). (C) Mitochondria and peroxisomes often cluster around chloroplasts in cotyledon and hypocotyl cells of WT seedlings following HL exposure (Movie S1 vs. Movie S2). (D) Similar clusters to “c” are observed in swollen cells of any1 even under 125 ± 10 μmol m2 s1 light intensity. Peroxisome numbers are often lower than mitochondria in these clusters. (E) A peroxule (px) extended by a chloroplast-associated peroxisome shows mitochondrial (m) association. (F) An independent peroxisome with extended peroxule associates with two mitochondria following a 4-min exposure to HL. (G) Dynamic extension (frames 1–3), retraction (frame 4) and change of direction of extension (frame 4,5) of a peroxule (px) from a chloroplast associated peroxisome. Multidirectional peroxule extension while the parent peroxisome remains in one location allows interactions with several mitochondria on different sides. A second peroxisome with an extended peroxule is indicated (large arrowhead). (H) Single cotyledon cell in the any1 mutant stably expressing YFP-PTS1 and mitoGFP shows several chloroplast-associated yellow-orange peroxisomes and peroxules (arrowheads) with clusters of mitochondria (green) (Movie S5). (I) A series of 17 sequential time-lapse snapshots of a hypocotyl cell of the double transgenic any1 mutant show a chloroplast-associated peroxisome (orange-yellow) extending a peroxule. Note that the peroxisome-chloroplast association remains strong despite the rotation of the chloroplast (arrow in panel 5) while the mitochondrial population (green) that comes in contact with the extended peroxule is maintained even though individual mitochondria may join and leave the cluster (Movie S6). (J) Hypocotyl cell in a triple transgenic Arabidopsis plant shows the typical associations formed between chloroplasts (c-blue) mitochondria (m-green) peroxisomes (p-yellow) and the ER (er-red) following a 4-min HL exposure (Movie S7). (K,L) Analysis of sequential snapshots of a mitochondria-peroxisome cluster (yellow-green) moving past chloroplasts (blue) on an ER defined path. 3D surface plots corresponding to panels K2, K3, K4 show clear yellow peaks indicating the presence of peroxisomes within the cluster whereas color thresh-holding and skeletonizing in “L” reveals the presence of a thin peroxule amongst mitochondria in panels K3 and K4. Size bars = (A,a) = 5 μm; (C,D) = 2.5 μm (E–I,K) = 5 μm; (J) = 10 μm.

