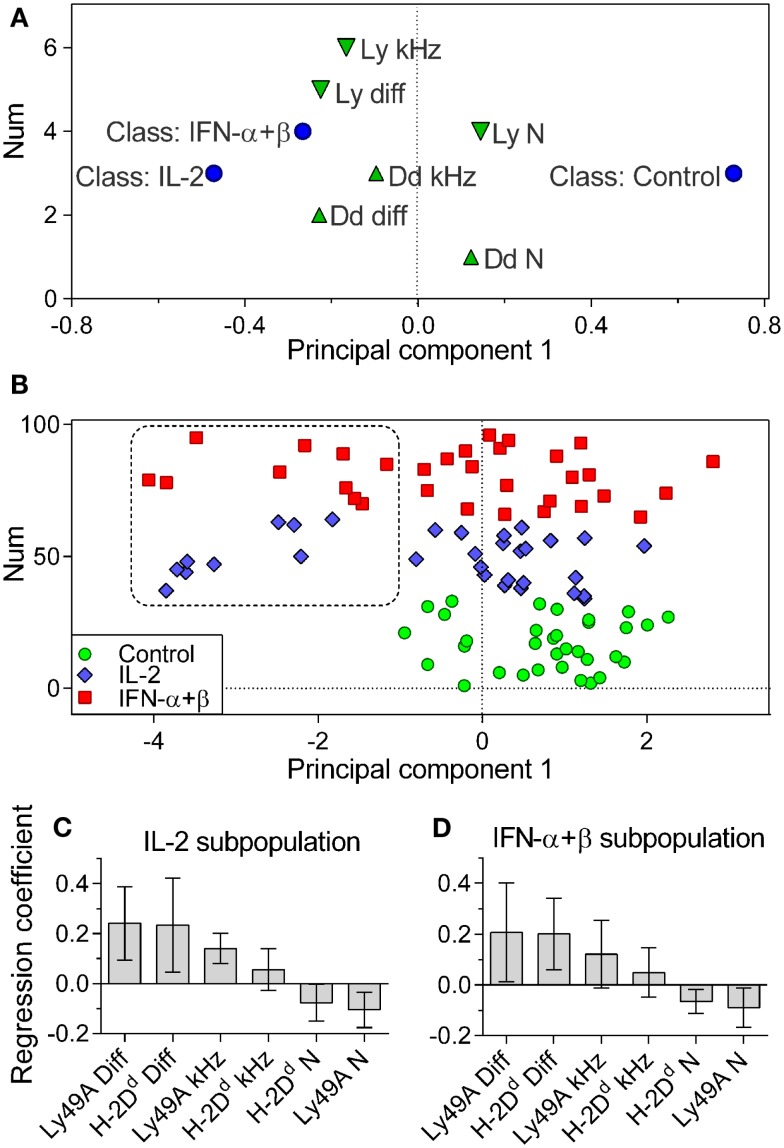
Figure 4.
Cytokine-stimulated cells contain a subpopulation of cells with rapidly diffusing entities. Multivariate OPLS-DA analysis of the FCS data. (A) Classes: Control, IL-2, and IFN-α + β stimulated cells (circles). Variables contributing to the separation: downward pointing triangles = Ly49A variables, upward pointing triangles = H-2Dd variables. Variables close in space to the class are positively correlated to that class. (B) The positioning of individual cells and the identification of a subpopulation of cytokine-treated cells, not overlapping with control cells. Circles, control cells; diamonds, IL-2 stimulated cells; squares, IFN-α + β-stimulated cells. Vertical axis label “Num” refers to the order of the values in the dataset and has no significance for the model. (C) Variables characterizing cells in the IL-2 subpopulation. (D) Variables characterizing cells in the IFN-α + β subpopulation. Diff, diffusion rate; kHz, brightness; N, density. Error bars in C and D represent the 95% confidence interval. The model was built only on cells where all variables were present for both Ly49A and H-2Dd: 33, 31, and 32 cells for Control, IL-2, and IFN-α + β, respectively. Cells pooled from seven independent experiments.

