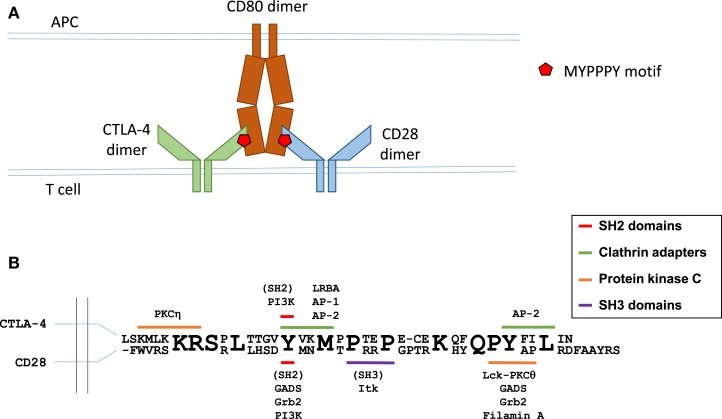
Figure 1.
Molecular interactions in B7 ligand recognition. (A) Schematic representation of CD28 and CTLA-4 binding to the B7 ligands. (B) Schematic representation of the cytoplasmic regions of CTLA-4 (top sequence) and CD28 (bottom sequence). Known interaction partners of CTLA-4 are shown above and of CD28 below the alignment, and the motifs implicated in these interactions are color coded as indicated. Figure based on Hou et al. (40), Isakov and Altman (41, 42), Margulies (43), Schneider and Rudd (36), Sharpe and Freeman (44), and Stamper et al. (45).

