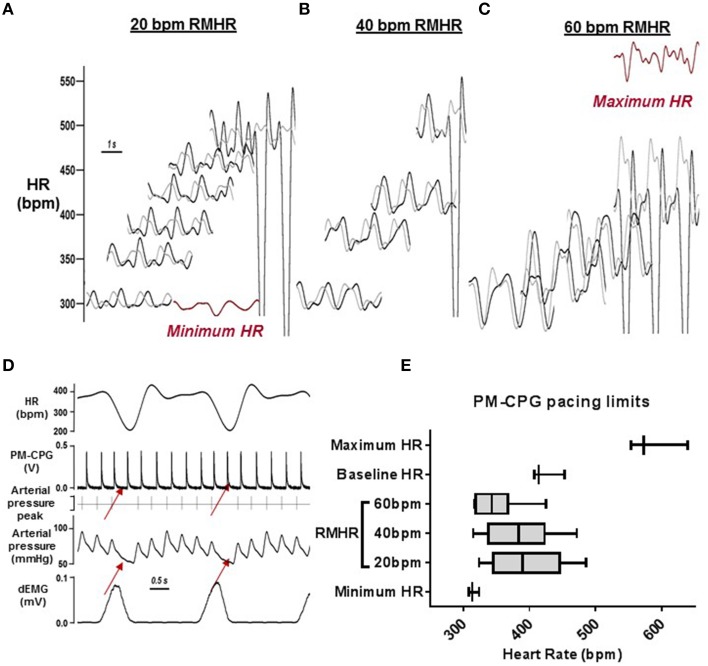
Figure 7.
RMHR generated by the PM-CPG: amplitude control. (A–C) Representative traces of the range of RMHR amplitudes (20, 40, and 60 bpm) and mean HR imposed by the PM-CPG output. The minimum and maximum HR waveforms are in red. (D) A representative example of the arrhythmia occurrence that determined the upper limit of PM-CPG pacing (red arrows). (E) Average heart rates achieved during PM-CPG pacing (n = 3) to shows the physiological upper and lower limits of applying RMHR to rats, relative to their baseline, minimum (with β-adrenoceptor blockade), and maximum HR. dEMG, diaphragmatic electromyogram; HR, heart rate; PM-CPG, hCPG as cardiac pacemaker; RMHR, respiratory modulated heart rate.

