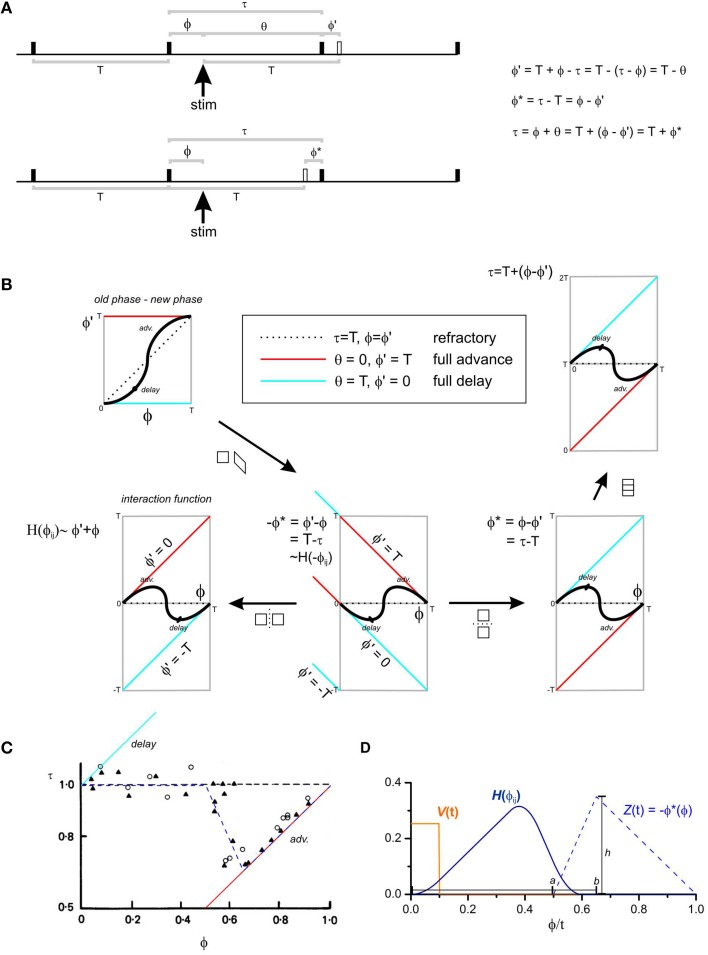
Figure 1.
Phase response curves and the interaction function. (A) An oscillator is represented by a horizontal time line and “fires” at each solid black uptick. The firing time could be defined as the upstroke of the slow wave. The oscillator has a natural period of T. T and all other variables can be defined either in units of radians (T = 2π), seconds (T = some value) or normalized to T (T = 1). A stimulus is given ϕ after a fire and the next fire is τ after this fire. Further measurements can be made, grouped according to two standpoints: (1) Upper time line, the oscillator “should have” fired T after the stimulus (hollow uptick). ϕ′ is the phase difference between when the oscillator did fire and when it “should have.” If ϕ′ = T, the oscillator fired immediately upon stimulation—the phase of the oscillator was fully advanced (box, center of B). Conversely if ϕ′ = 0, the oscillator fired at the time it “should have”—the phase of the oscillator was fully delayed (box, center of B). If ϕ′ = ϕ, then the stimulus had no effect on the firing of the oscillator—it was refractory. Another measurement used is the cophase (θ) the time between the stimulus and the first fire. (2) Lower time line, the oscillator “should have” fired T after it's last fire (hollow uptick). ϕ* is the phase difference between when the oscillator did fire and when it “should have.” (B) There are a number of conventions for the plotting of phase response curves. The abscissa is always the phase of the stimulus (ϕ), but the ordinate can be ϕ′, −ϕ*, ϕ*, or τ (anticlockwise from left). ϕ′(ϕ) is known as an “old phase—new phase” phase response curve (Winfree, 1980). All the phase response curves can be related by simple geometric transforms (arrows). The interaction function, H(ϕ) is a reversed and smoothed version of the infinitesimal phase response curve −ϕ*(ϕ) (Equation 5). (C) τ(ϕ) with T-normalized units for slow waves recorded from the rabbit small intestine, modified from Figure 3A of Cheung and Daniel (1980). Triangles and circles are circular and longitudinal muscle responses, respectively, to 5 ms, 80 V pulses. The slow waves are refractory until halfway through their cycle at which point they phase advance, reaching full phase advance (responding immediately to a stimulus) about 7/10 of the way through the cycle. The blue dashed line is the infinitesimal phase response curve used for our model (Equation 6). (D) Model infinitesimal phase response curve Z(t), impulse V(t) and interaction function H(ϕij). a, b, and h are the parameters used to define Z(t) (Equation 6).

