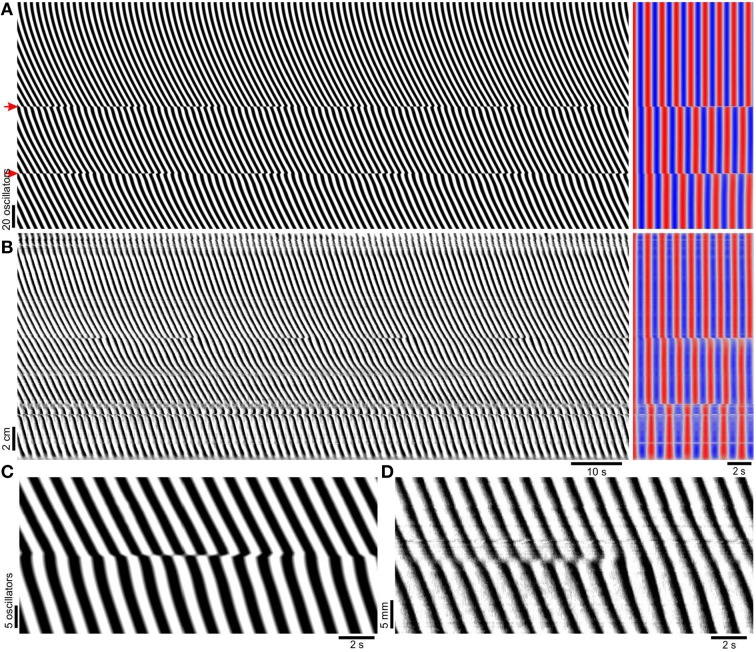
Figure 3.
Induction of frequency steps by localized decoupling. (A) Model diameter map (left), and its autocorrelation (right). The top of the map corresponds to the proximal (higher frequency) end. Time scales are indicated below (B). The model has the same parameters as in Figure 2A, but with coupling strength reduced by 90% (k = 0.3) at the points marked with red arrows. At the points of reduced coupling there are clear steps in frequency, corresponding to positions of dislocations in the DMap. (B) Experimental diameter map of murine small intestine (left) in the presence of 0.5 mM lidocaine to block enteric nervous system activity and its autocorrelation (right). The top of the map corresponds to the proximal end. (C) A dislocation from the model DMap in (A). (D) A dislocation from the small intestine DMap in (B).

