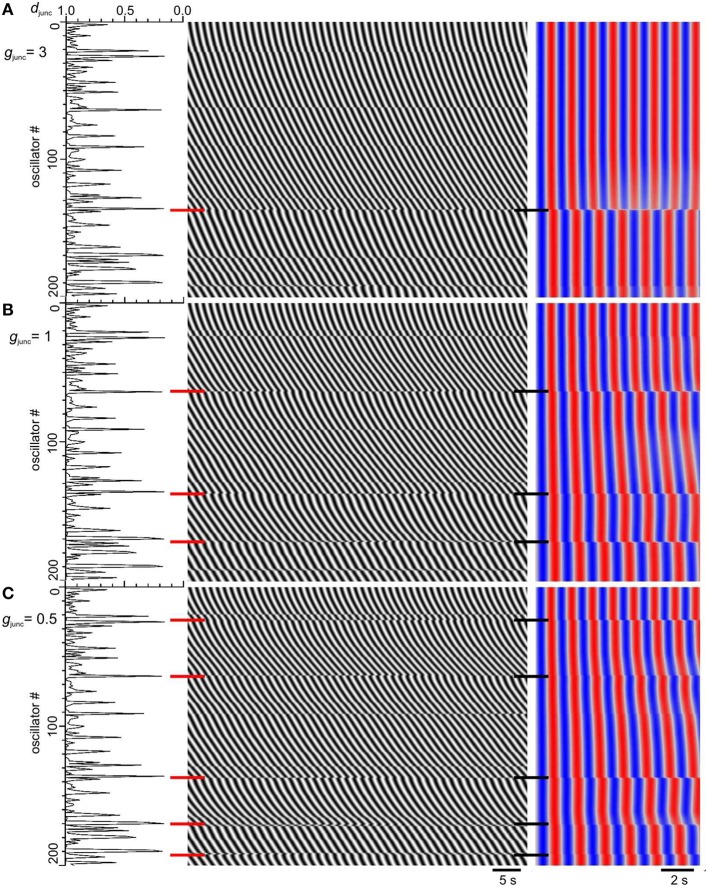
Figure 6.
Increase in frequency steps as gap junction conductance is decreased. Model djunc (left), DMaps (middle), and autocorrelation (right). The top of the maps correspond to the proximal (higher frequency) end. Gap junction density (djunc) had a long tailed distribution and gap junction conductance (gjunc) was either 3 (A), 1 (B), or 0.5 (C). Red and black horizontal bars, frequency step positions.

