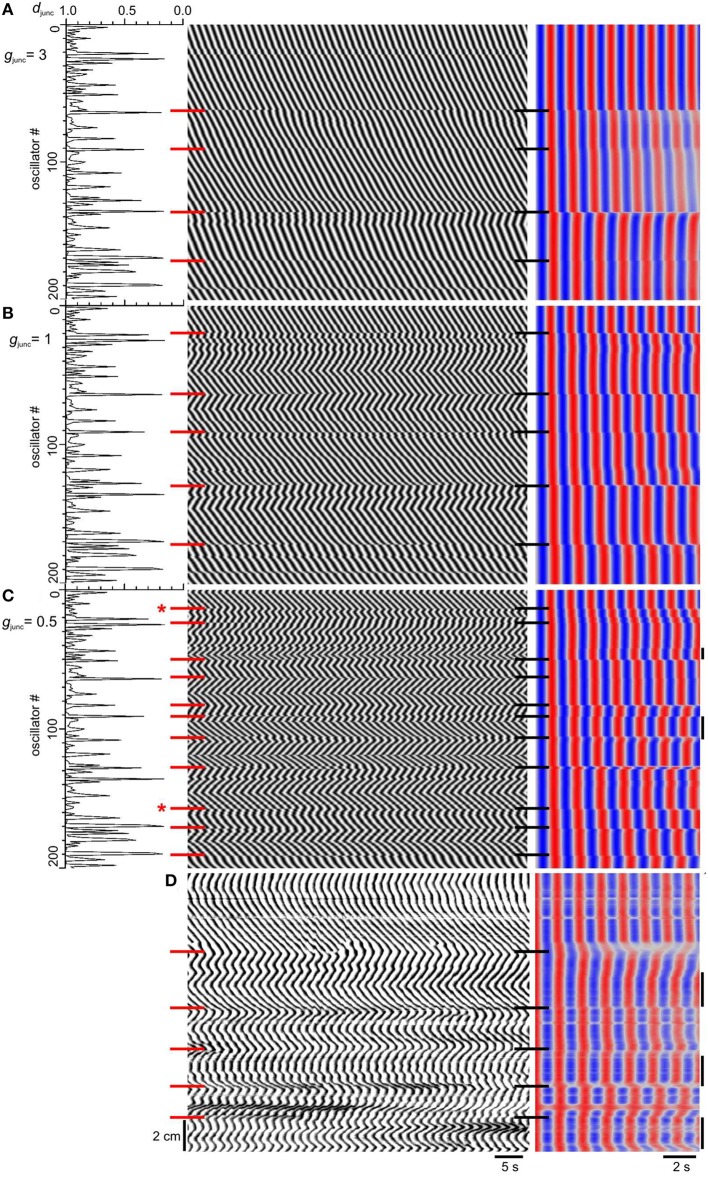
Figure 7.
Effect of natural frequency spatial noise on emergence of frequency steps. (A–C) Model djunc (left), DMaps (middle) and autocorrelation (right). The top of the maps correspond to the proximal (higher frequency) end. The natural intervals were distributed normally about their gradient (1.2–1.5 s) with a standard deviation of 30 ms. Gap junction density (djunc) had a long tailed distribution and gap junction conductance (gjunc) was either 3 (A), 1 (B) or 0.5 (C). Red and black horizontal bars, frequency step positions. Bars with asterisk indicate where frequency steps are not coincident with dips in djunc. High frequency islands are indicated by vertical bars at the right of the autocorrelation. (D) DMap and autocorrelation of murine small intestine in the presence of 40 μM carbenoxolone. The top of the map corresponds to the proximal end.

