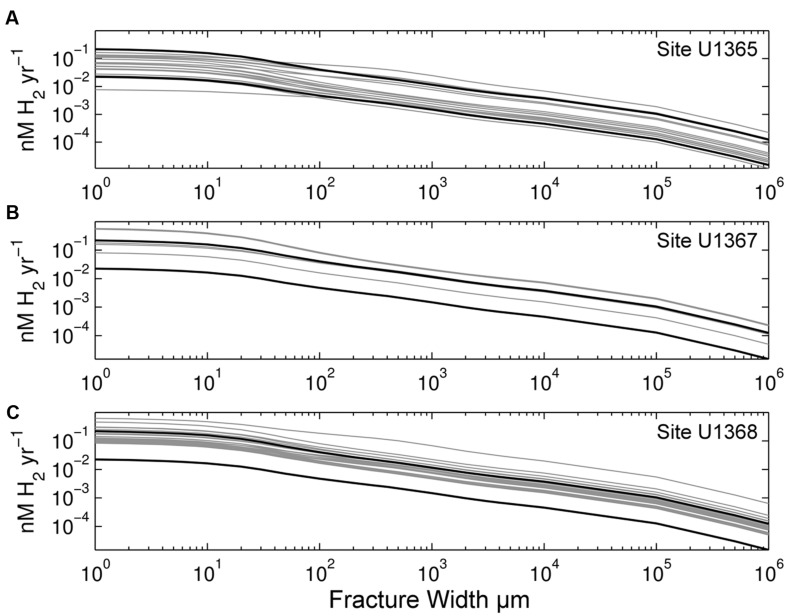
FIGURE 2.
Radiolytic H2 production rates calculated from radionuclide concentrations of our SPG samples. Volume-normalized rates are shown as a function of fracture width for (A) Site U1365, (B) Site U1367, and (C) Site U1368. Black lines mark maximum and minimum rates calculated from EPR glass samples (Gale et al., 2013). Note that both axes are log scale.

