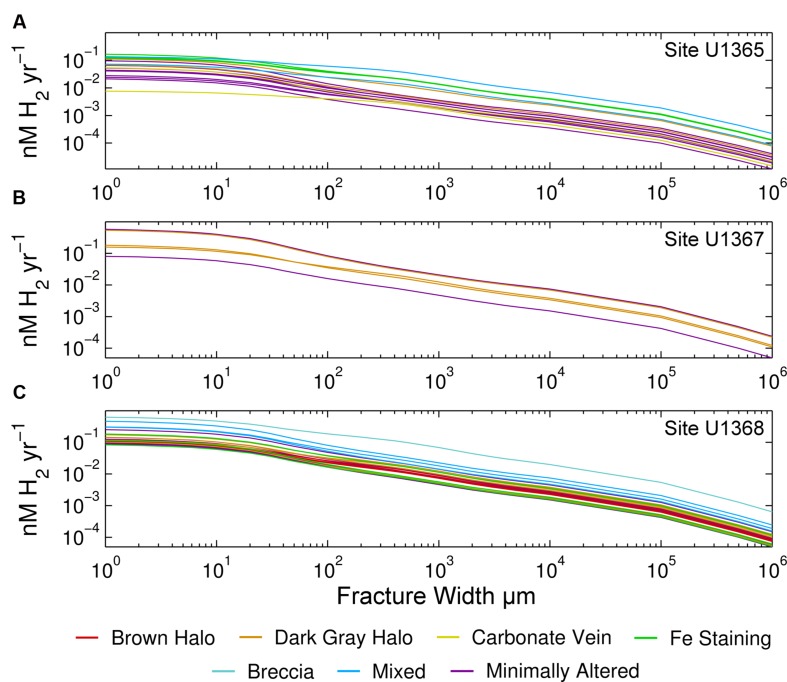
FIGURE 3.
Relation of rock alteration to radiolytic H2 production rates. Volume-normalized rates are given for Sites (A) U1365, (B) U1367, (C) U1368. Colors show the alteration type to which we assigned each sample. Note that both axes are log scale. As in Figure 2, rates are given as a function of fracture width.

