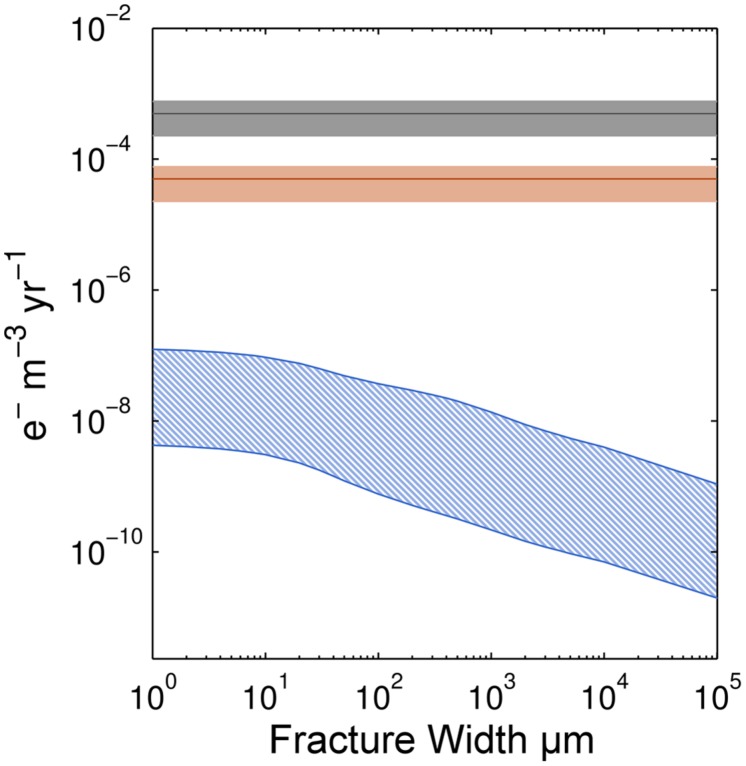
FIGURE 5.
Comparison of electron transfer rates supportable by Fe oxidation and radiolytic H2 production. Ranges of electron (e-) transfer rates due to Fe oxidation are shown for basalt of two different ages, 1 and 10 Ma shown by the gray and orange shading, respectively. The blue-hatched region indicates the range of electron transfer supportable by radiolytic H2 production.

