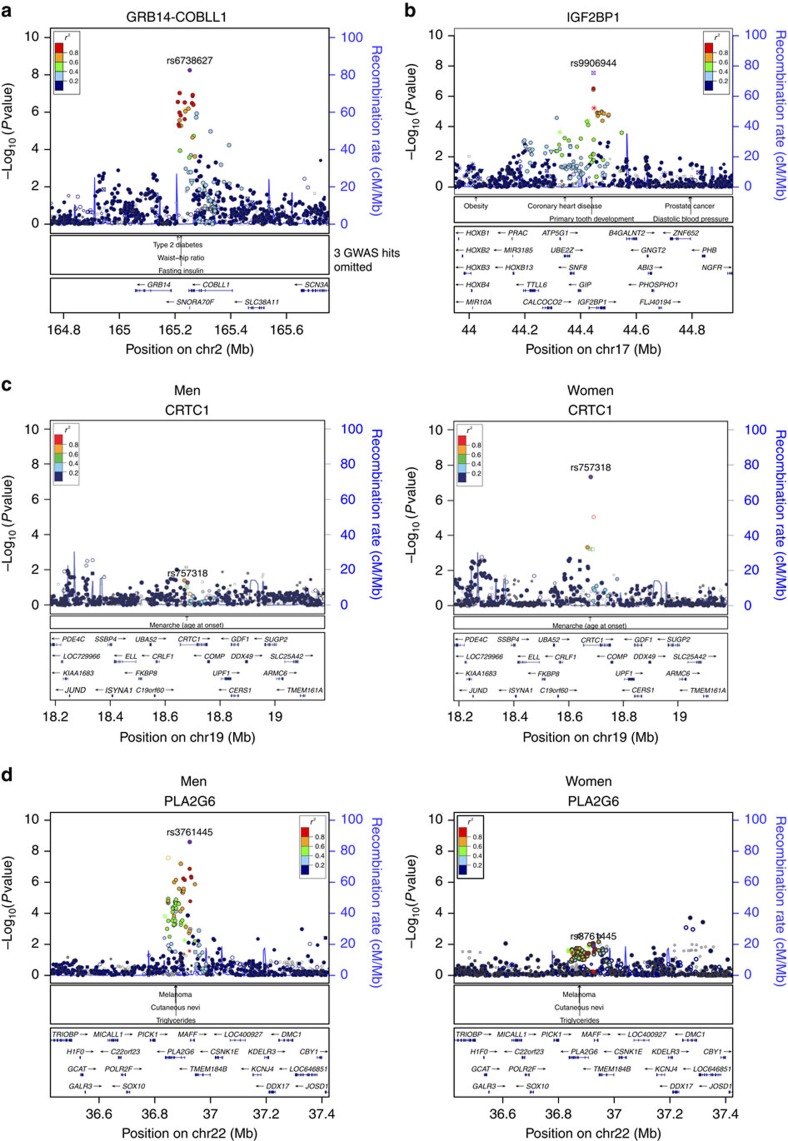
Figure 1. Regional plots of the four newly identified loci that reached genome-wide significant association with body fat percentage.
Regional plots of the four newly identified loci that reached genome-wide significant association with body fat percentage in all-ancestry analyses, in men and women combined for the COBLL1/GRB14 and IGF2BP1 loci (a,b), and separately for the CRTC1 and PLA2G6 (c,d). Each symbol represents the significance (P value on a −log10 scale) of a SNP with BF% as a function of the SNP's genomic position (NCBI Build 36). For each locus, the index SNP is represented in the purple colour. The colour of all other SNPs indicates LD with the index SNP (estimated by CEU r2 from the HapMap Project data Phase II CEU). Recombination rates are also estimated from International HapMap Project data, and gene annotations are obtained from the UCSC Genome Browser. GWAS catalogues SNPs with P value <5 × 10⁻⁸ are shown in the middle panel. Different shapes denote the different categories of the SNPs: up-triangle for framestop or splice SNPs, down-triangle for nonsynonymous SNPs, square for coding or untranslated region (UTR) SNPs; star for SNPs in tfbscons region, square filled with ‘X' symbol for SNPs located in mcs44placental region and circle for SNPs with no annotation information.

