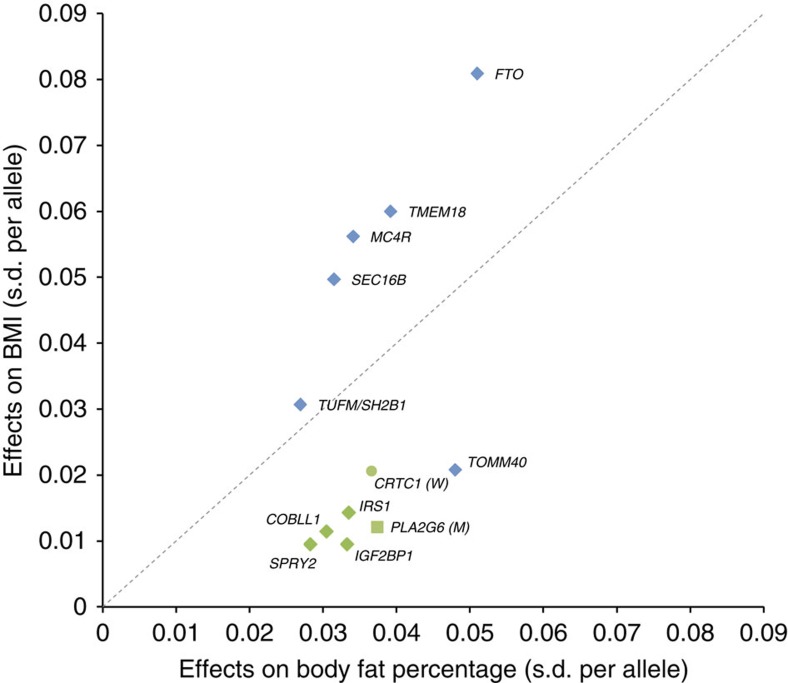
Figure 2. Comparison of effects of the 12 loci on body fat percentage (x axis) and on BMI (y axis).
Both outcomes (BMI and BF%) were inverse normally transformed (mean 0, s.d. 1) such that effects sizes are at the same scales and directly comparable. Effect sizes for BMI were obtained from Locke et al.19. The allele effects for the PLA2G6 (square) and CRTC1 (round) loci were derived, respectively, from the men- and women-based meta-analyses. Six loci had first been identified for BMI (blue), whereas six others were first identified for BF% (green).

