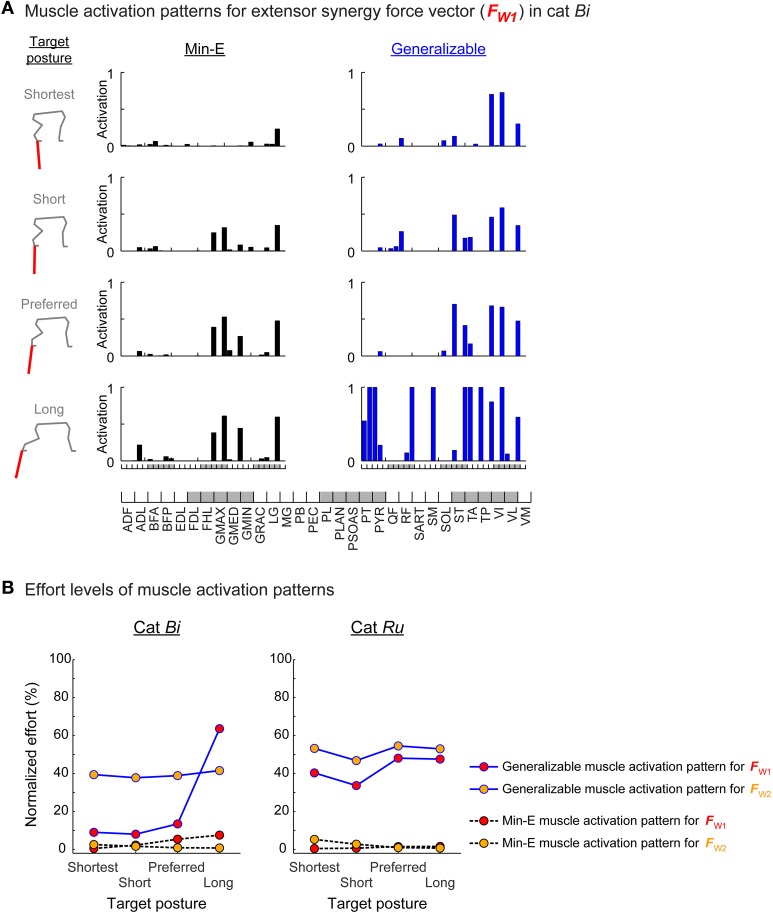
Figure 3.
Muscle patterns and effort levels of the min-E and generalizable muscle activation patterns. (A) Muscle patterns of the min-E and generalizable muscle activation patterns found for the extensor synergy force vector at each target posture in cat Bi. Each bar represents recruitment level of individual muscle in the min-E (left column, black bars) and the generalizable (right column, blue bars) muscle activation patterns. (B) Effort level comparisons of the generalizable muscle activation pattern (dots on blue solid lines) and the min-E muscle activation pattern (dots on black dotted lines) at each target posture for the extensor (red circles) and flexor (yellow circles) synergy force vectors. Effort levels were normalized to the maximum possible effort level in each target posture. The generalizable muscle activation patterns were always suboptimal in terms of effort.

