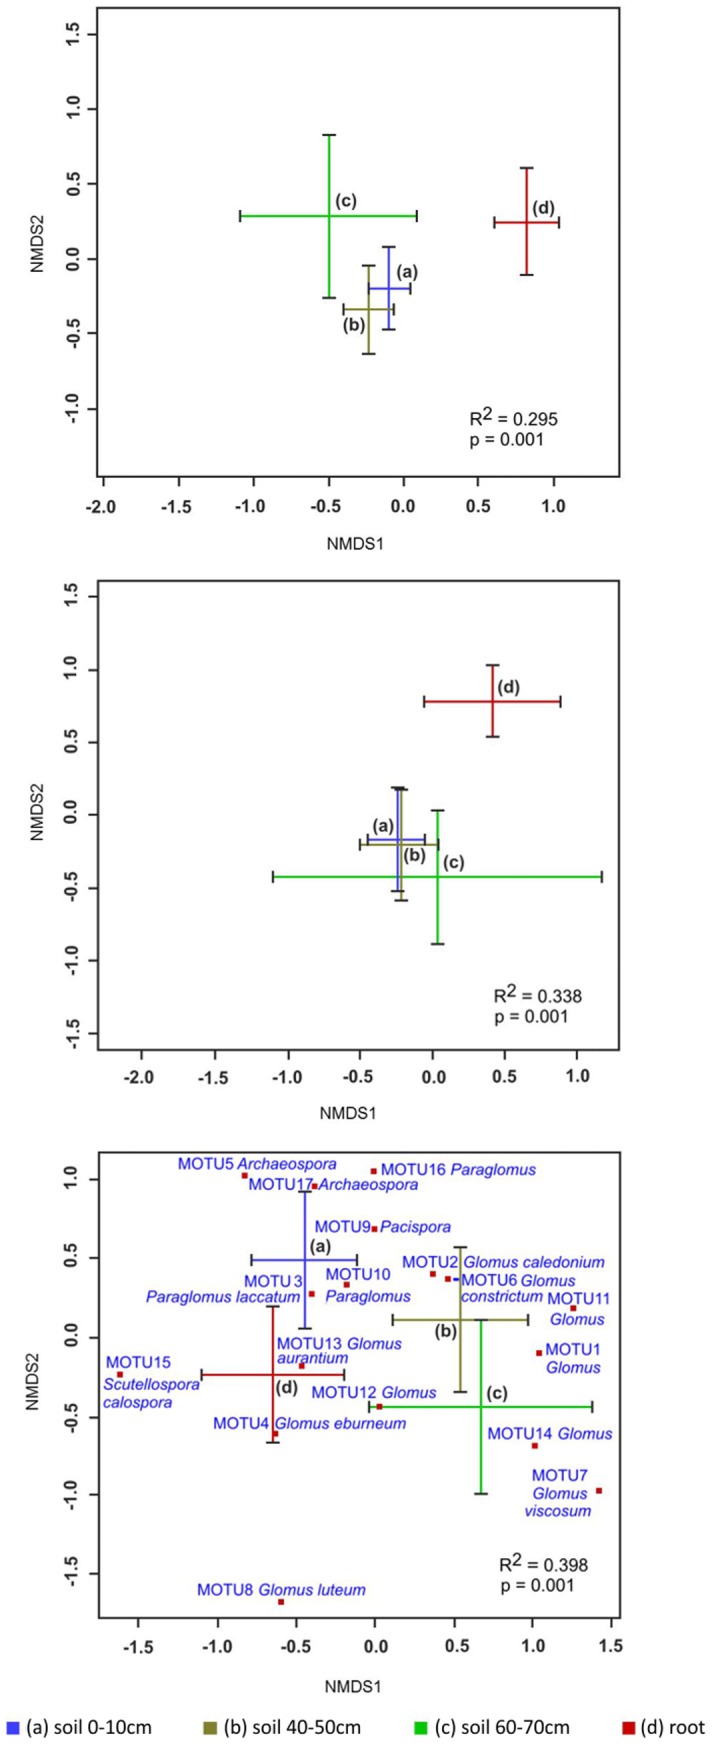
Fig 2. Two-dimensional non-metric multidimensional scaling (NMDS) biplots based on Bray-Curtis distances displaying differences of A) the total fungal community in the ITS dataset, B) yeasts and dimorphics in the ITS dataset and C) AMF from SSU rDNA dataset in relation to compartment.

Bars represent one standard deviation along both NMDS axes. Only C is labeled with individual MOTUs for readability. Stress value was for A) 0.15, for B) 0.16 and for C) 0.12.
