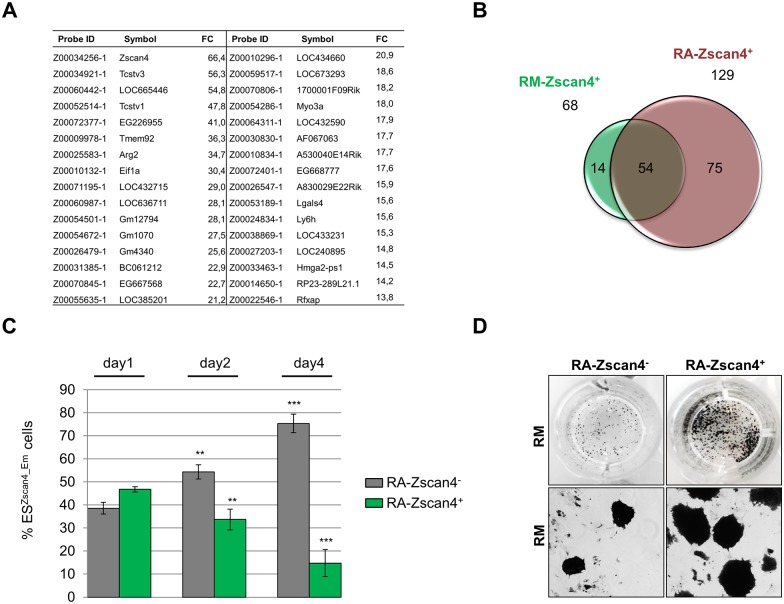
Fig 4. RA-Zscan4+ cells molecular and cellular characterization.
(A) The global gene expression profiles between RA-Zscan4+ and RA-Zscan4- cell populations by DNA chip microarray hybridization. List of RA-Zscan4+ probes upregulated more than 20-fold compared to RA-Zscan4-. (B) RA-Zscan4+ cells expression versus RM-Zscan4+. (C) RA-Zscan4+ and RA-Zscan4- cells were collected, separated by FACS and plated in RM. The mean % RA-Zscan4+ or RA-Zscan4- cells ± SD of three independent experiments is presented with statistical analysis performed using Student’s t test (**, p < .01; ***, p < .001). (D) RA-Zscan4+ and RA-Zscan4- cells were collected and separated by FACS, plated in RM and were characterized based on AP-positive colonies after 5 days in RM (n = 3).

