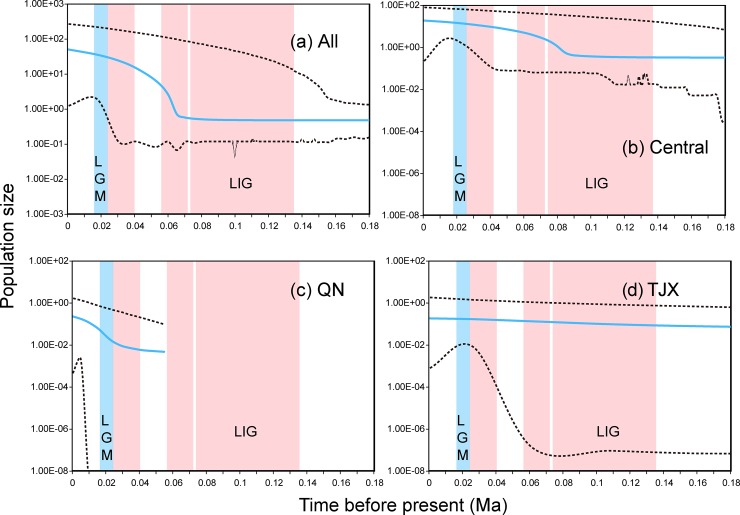
Fig 5. Extended Bayesian Skyline plots for all the main clades of P. roborovskii.
The solid lines indicate the median value of effective population size; the dashed lines denote the 95% highest posterior probability interval. The discarded part showed no change of effective population size. The red-shaded regions represent interglacial periods and were drawn based on the chronology of Quaternary glaciations in China summarized by [52]. The first one represents the Last Interglacial (LIG). The blue shaded-region represents the Last Glacial Maxima (LGM).

