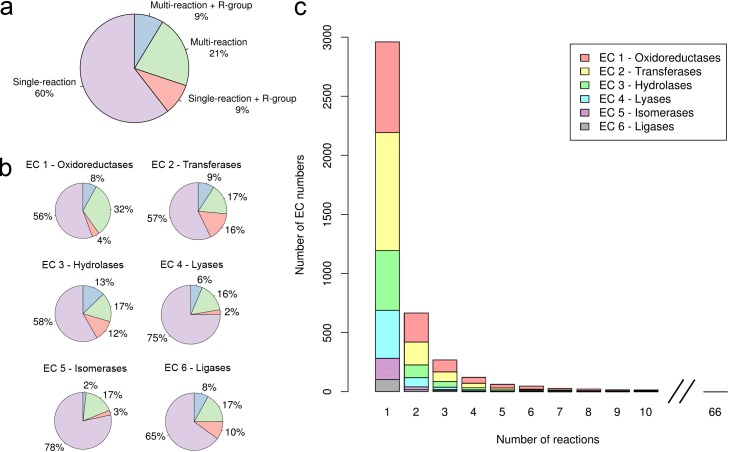
Fig 1. Survey of EC numbers associated with more than one enzyme reaction.
(a) Overall distribution. Coloured slices indicate single and multi-reaction EC numbers. “R-group” represents EC numbers containing a Markush label in at least one reaction (see Generic reactions in main text) (b) Distribution by EC class (c) Distribution of EC numbers according to the number of reactions.

