Fig. 2.

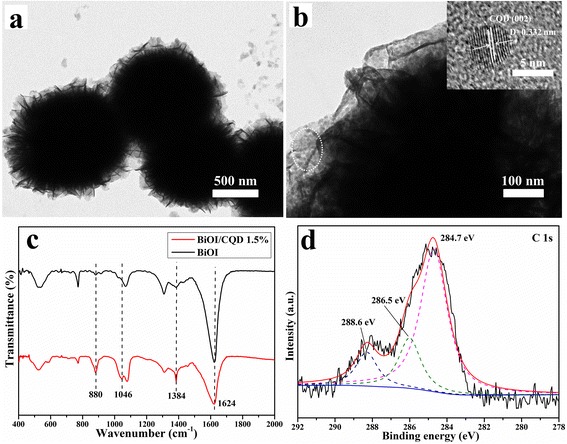
The TEM images of CQD/BiOI 1.5 wt.% sample (a, b). FT-IR spectra of pure BiOI and CQD/BiOI 1.5 wt.% samples (c). the XPS C 1s spectra of the CQD/BiOI 1.5 wt.% samples (d)

The TEM images of CQD/BiOI 1.5 wt.% sample (a, b). FT-IR spectra of pure BiOI and CQD/BiOI 1.5 wt.% samples (c). the XPS C 1s spectra of the CQD/BiOI 1.5 wt.% samples (d)