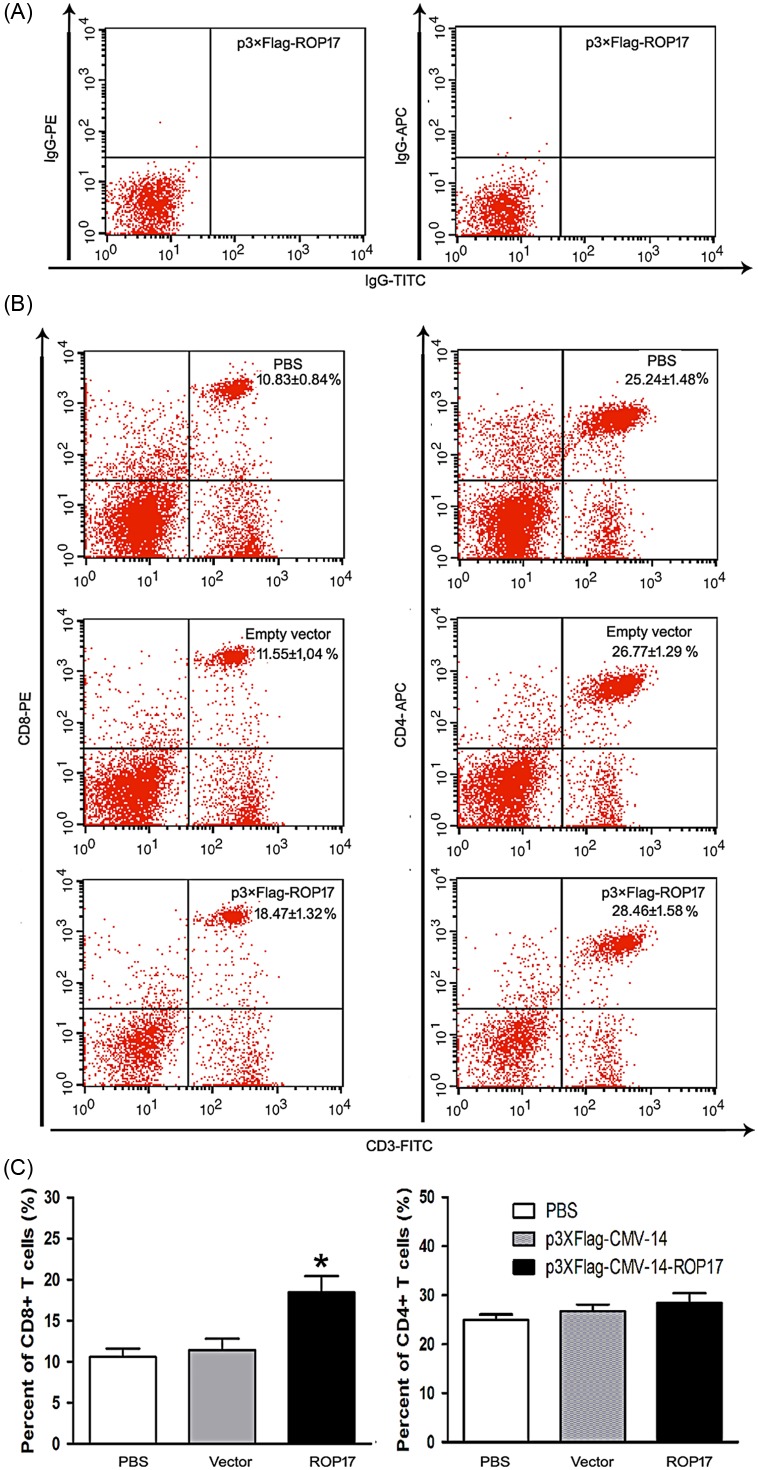
Figure 3.
Lymphocyte subpopulations determined in ROP17 DNA-immunized mice by FACS. (A) The total mouse spleen cells were analyzed by using mouse FITC-IgG, PE-IgG, and APC-IgG for quality control. (B and C) The percentages of CD3+/CD4+ and CD3+/CD8+ T lymphocytes in the total spleen cells were calculated using flow cytometry analysis. Results are expressed as mean values ± SD (n = 6). *P < 0.05 relative to control groups.

