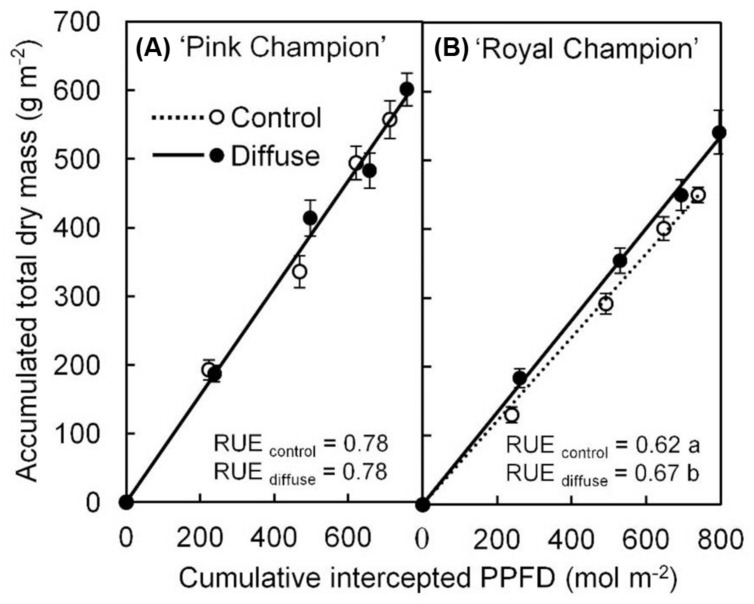
FIGURE 1.
Relationship between accumulated TDM and cumulative intercepted PPFD for ‘Pink Champion’ (A) and ‘Royal Champion’ (B) in the control and diffuse light treatments. Solid and dashed lines represent fitted linear relationships for diffuse light and control treatments, respectively. The slope of the fitted linear relationship is the RUE of biomass production (g dry mass mol-1 PPFD). Dashed line in ‘Pink Champion’ is obscured by the solid line. Error bars show ±SE (n = 12). Letters show statistical significant differences (P < 0.05).

