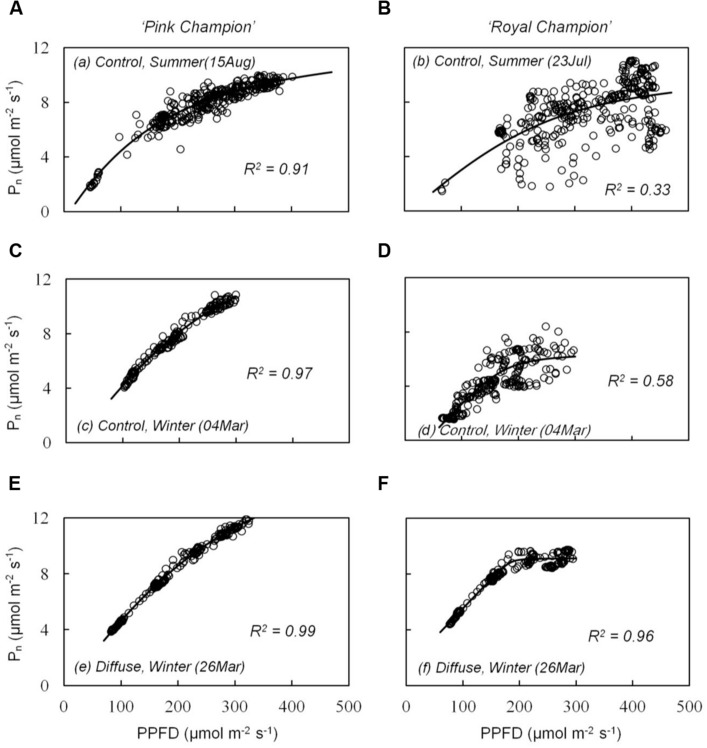
FIGURE 4.
Relationship between instantaneous net leaf photosynthesis rates (Pn) and transient PPFD in compartment with clear glass (control: A–D) and diffuse glass (E,F). ‘Pink Champion’ is shown in (A,C,E) and ‘Royal Champion’ in (B,D,F). Pn and incident PPFD were recorded at 1 min interval on one fully expanded leaf and continuously measured for 2–4 h. Lines represent the best fit of a non-rectangular hyperbola (Eq. 2). Each panel shows an example of one measurement (one replicate) under the specific treatment on clear day.

