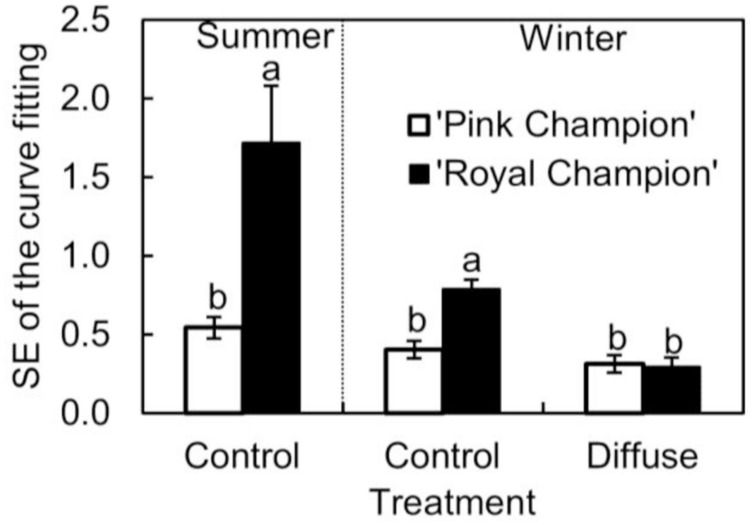
FIGURE 5.
Standard error of fitting non-rectangular hyperbola to instantaneous net leaf photosynthesis rates as a function of incident PPFD (Eq. 2) in summer growing season in the control treatment (n = 3), and in winter growing season in the control as well as in diffuse light treatments (n = 4; as see in Figure 4 which shows one replicate under each specific condition). Data used for curve fitting in this figure were collected on clear days. Error bars show ± SE. Letters within each growing season show statistical significant differences (P < 0.05).

