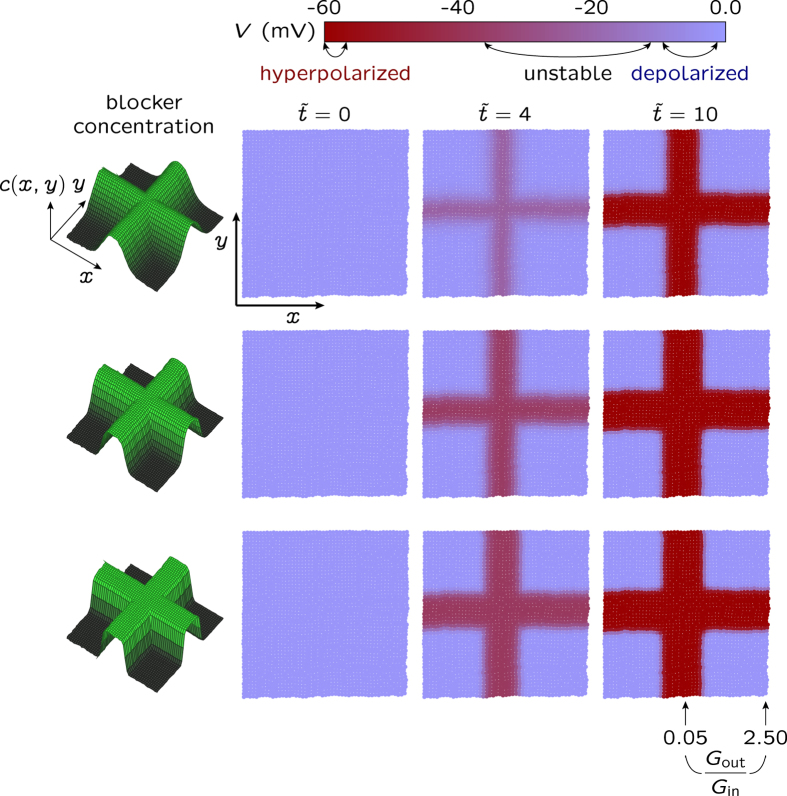
Figure 7. Patterning of the spatio-temporal map of cell potentials caused by a two-dimensional blocker concentration.
The map is obtained for the cell parameters in Fig. 6 when the local conductance ratio Gout/Gin is regulated by the blocker concentration c(x,y) shown in the left, where x and y are the spatial coordinates (see the Methods section). The bioelectrical patterning of the multicellular ensemble with hyperpolarized and depolarized potential regions closely follows the blocker concentration c(x,y) acting on the outward-rectifying channel. As in Fig. 6, c(x,y) gives conductance ratios which vary between Gout/Gin = 0.05 (central cross in the potential map, maximum blocker concentration) and 2.5 (map corners, minimum blocker concentration). The range of membrane potential values obtained from the changes in the above conductance ratio is shown in the cell potential bar (top). This figure illustrates the establishment of electrical multicellular patterns by changing the relative contributions of specific channels to the cell membrane conductance.

